“¢ The pair built on the overnight bullish break through a short-term descending trend-line hurdle and climbed to near three-week highs on Friday.
“¢ The up-move now seems to have paused at an important resistance near mid-111.00s, also coinciding with 50% Fibonacci retracement level of the 113.18-109.77 recent slide.
“¢ Technical indicators on hourly charts are holding in bullish territory and have also started to turn positive on the daily chart.
“¢ Hence, dips back towards the 111.00 handle are more likely to be utilized as an opportunity to initiate fresh bullish positions and hence, should help limit any immediate downside.
USD/JPY 4-hourly chart
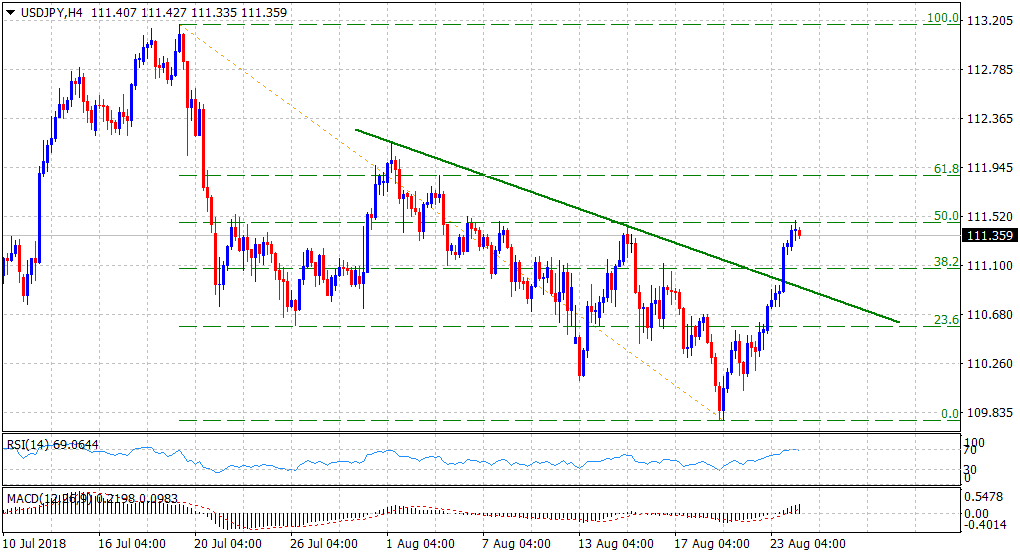
Spot Rate: 111.36
Daily High: 111.49
Daily Low: 111.23
Trend: Bullish
Resistance
R1: 111.49 (current day swing high)
R2: 111.87 (R2 daily pivot-point)
R3: 112.15 (monthly high set on Aug. 1)
Support
S1: 111.07 (38.2% Fibo. level)
S2: 110.75 (S1 daily pivot-point)
S3: 110.52 (overnight swing low)
