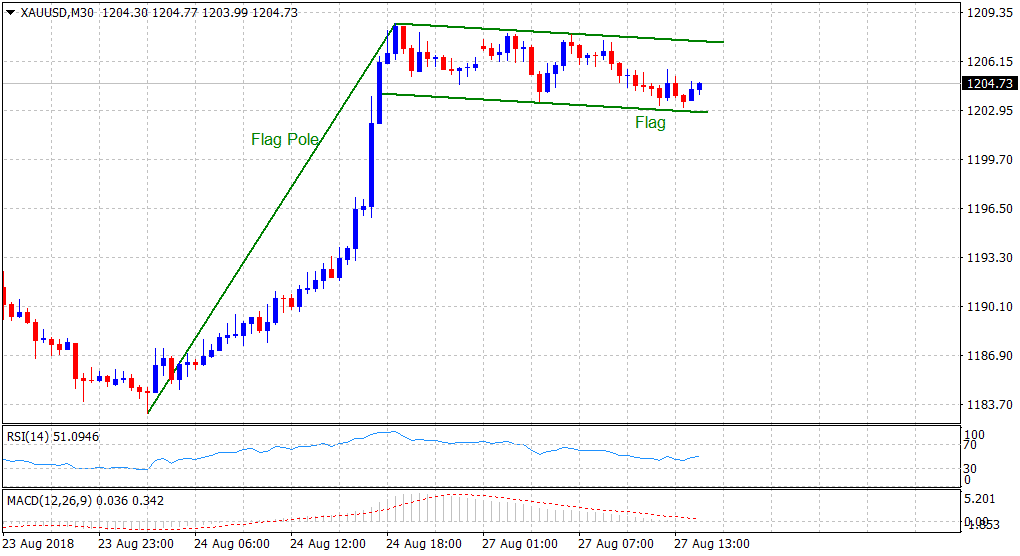
“¢ The precious metal has been oscillating in a narrow trading range, forming a bullish continuation – flag chart pattern on the 30-min. chart.
“¢ Technical indicators on hourly charts hold in bullish territory but are yet to catch up with the positive momentum on the daily chart.
“¢ Against the backdrop of Friday’s strong upsurge of around 1.75%, today’s price action would still be categorized as a consolidation phase.
“¢ A convincing break through Friday’s swing high would reinforce the bullish outlook and pave the way for additional gains in the near-term.
Gold 30-min. chart
Spot Rate: $1204.52
Daily Low: $1203.11
Daily High: $1207.98
Trend: Sideways consolidation phase
Resistance
R1: $1208.62 (Friday’s swing high)
R2: $1211.71 (200-period SMA H4)
R3: $1216.50 (horizontal zone)
Support
S1: $1200 (psychological round figure mark)
S2: $1194.01 (10-day SMA)
S3: $1189.36 (S1 weekly pivot-point)
