“¢ The pair’s intraday recovery move has been alongside an ascending trend-channel formation on the shorter timeframe, with bulls just managing to hold on to the channel support.
“¢ Mixed technical indicators have failed to support any firm directional bias and traders now await a convincing break through the channel before positioning for any meaningful momentum.
“¢ A convincing break below the 111.00 handle would invalidate prospects for any intraday recovery and turn the pair vulnerable to head back towards challenging the key 100-day SMA support.
USD/JPY 5-min. chart
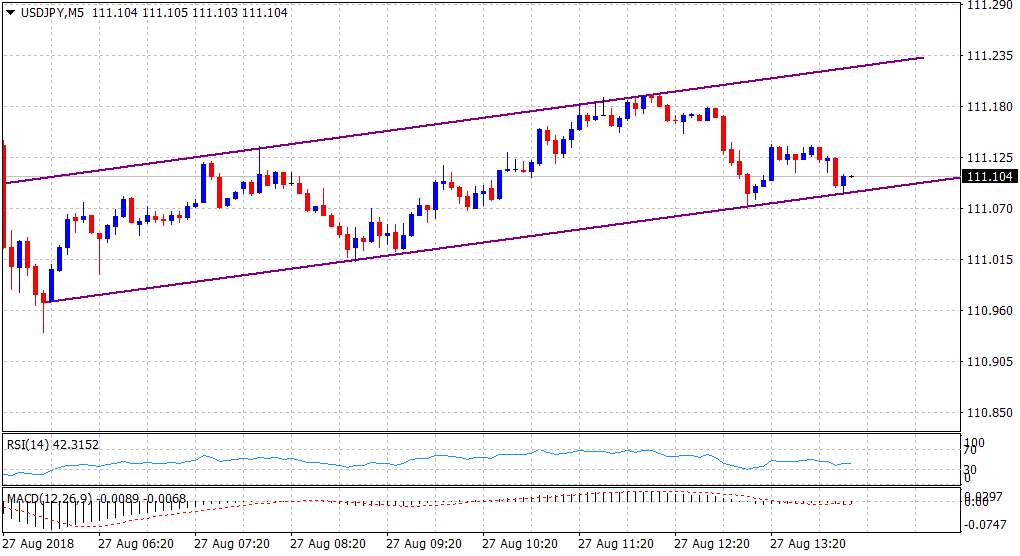
Spot Rate: 111.10
Daily Low: 110.94
Daily High: 111.35
Trend: Neutral
Resistance
R1: 111.35 (200-period SMA)
R2: 111.68 (R2 daily pivot-point)
R3: 112.00 (round figure mark)
Support
S1: 110.94 (current day swing low)
S2: 110.65 (S3 daily pivot-point)
S3: 110.11 (100-day SMA)
