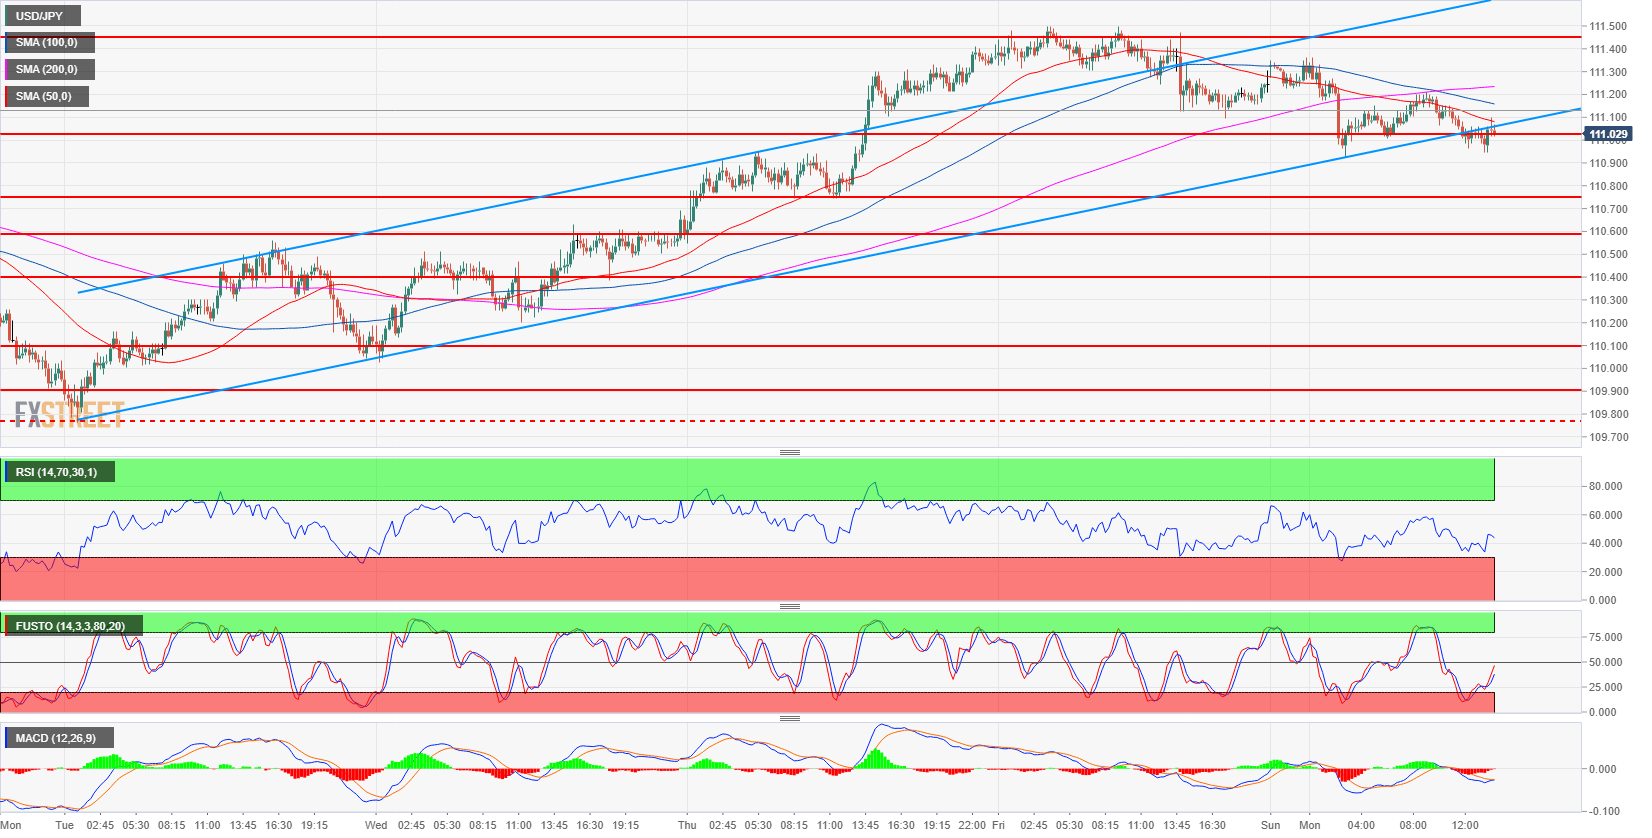
- USD/JPY main bull trend is in pullback mode since July 19. On August 21, bulls created a swing low and are now trying to resume the bull trend.
- USD/JPY is trying to find support at the lower trendline of the bull channel around the 111.00 level. However, the 50 and 100-period simple moving average broke below the 200 SMA suggesting that the bullish momentum is slowing down. Targets to the upside are 111.45 and 111.54-111.64 area.
- A bear breakout below 110.90 (current daily low) would invalidate the bullish bias.
Spot rate: 111.00
Relative change: -0.19%
High: 111.36
Low: 110.92
Main trend: Bullish
Resistance 1: 111.45 August 8 high
Resistance 2: 111.54-111.64 area, August 6, high and supply/demand level
Resistance 3: 111.82-112.00 area, supply level and figure
Support 1: 111.00 figure
Support 2: 110.75, July 23 low
Support 3: 110.58 July 26 swing low
Support 4: 110.40 supply/demand level
Support 5: 110.10 August 13 swing low
Support 6: 109.91-97 area, 200 and 100-day simple moving average
Support 7: 109.37 June 25 swing low
Support 8: 109.19 June 8 low
