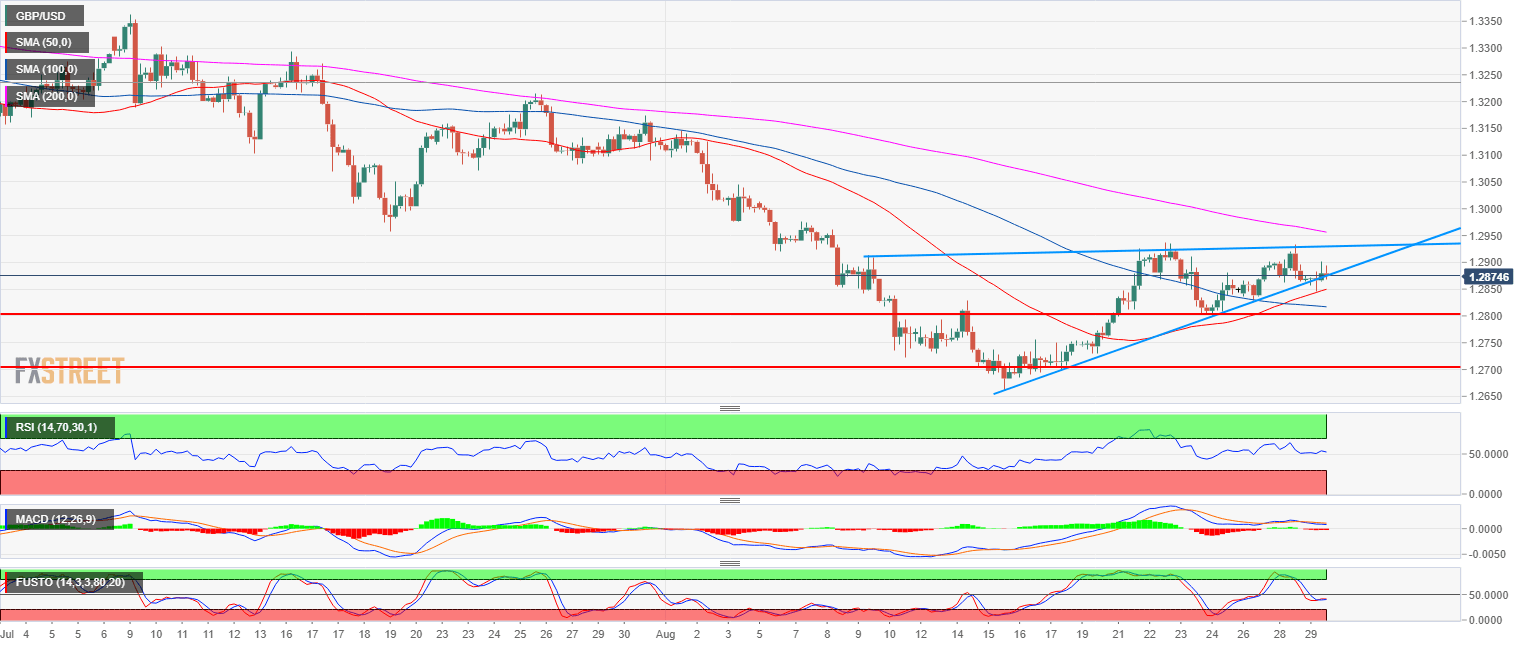
- Cable bears are at work trying to resume the main bear trend.
- GBP/USD created wedge and double top pattern. Bears are trying to break below the bull trendline and the 4-hour 50-period simple moving average. If sellers are able to break below the bullish trendline the first target is located at 1.2800 followed by 1.2700 figure.
- A bull breakout above 1.2937 (August 22 swing high) would invalidate the bearish bias.
Spot rate: 1.2877
Relative change: 0.03%
High: 1.2902
Low: 1.2845
Trend: Bullish above 1.2937 (August 22 swing high)
Resistance 1: 1.2900 figure
Resistance 2: 1.2937 August 22 swing high
Resistance 3: 1.2957 July 19 swing low
Resistance 4: 1.3082-1.3100 supply/demand level and figure
Resistance 5: 1.3214 July 26 swing high
Support 1: 1.2868 August 22 low
Support 2: 1.2838, August 10 high
Support 3: 1.2800 figure
Support 4: 1.2700-1.2723 zone, figure and August 10 low
Support 5: 1.2700 figure
Support 6: 1.2661 current 2018 low
