“¢ The precious metal has now broken below a bearish continuation – flag chart pattern formation on the 15-min. chart and was being weighed down by a modest USD uptick.
“¢ Technical indicators have gradually started losing positive momentum and hence, the commodity remains vulnerable to extend overnight retracement slide from over two-week tops.
“¢ A convincing break back below the key $1200 psychological mark will reaffirm that the recent corrective bounce is already over and pave the way for the resumption of the prior depreciating move.
Gold 15-min. chart
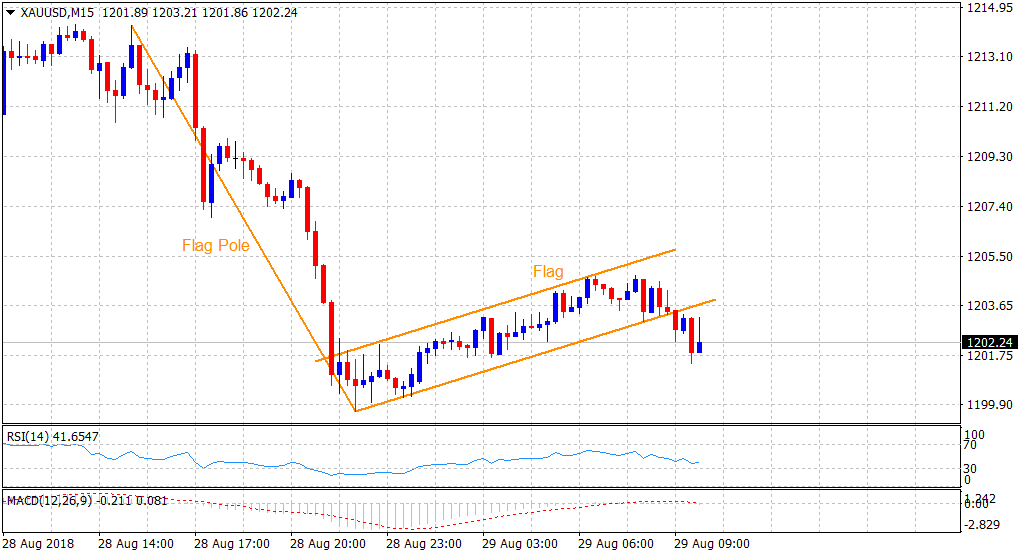
Spot Rate: $1202.24
Daily High: $1204.80
Daily Low: $1200.70
Trend: Bearish below $1200 mark
Resistance
R1: $1210.25 (R1 daily pivot-point)
R2: $1214.32 (overnight swing high)
R3: $1224.87 (50-day SMA)
Support
S1: $1195.19 (100-period SMA H1)
S2: $1189.92 (S2 daily pivot-point)
S3: $1183.15 (last Friday’s swing low)
