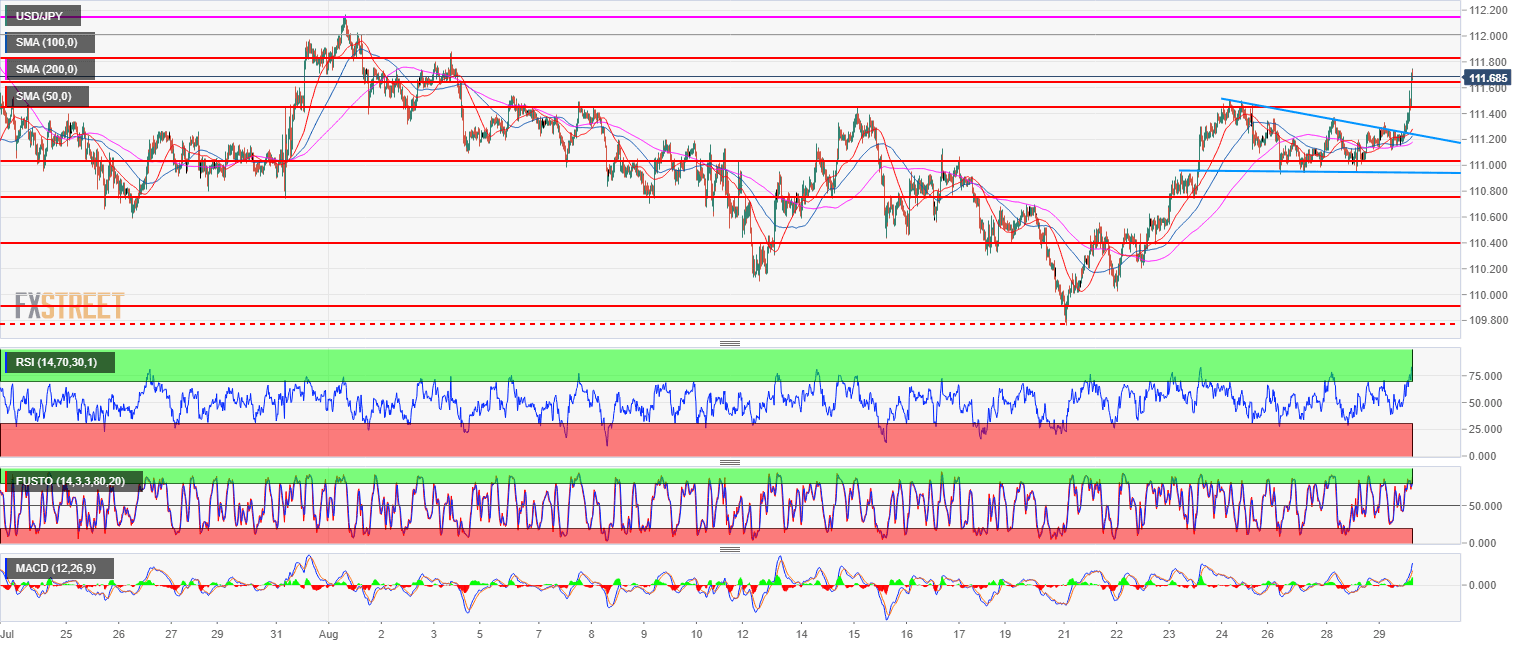
- USD/JPY buyers are pressing their bets in the direction of the main bull trend.
- USD/JPY broke above the bull flag, the next target is 112.00-112.15 zone (figure and August 1, swing high).
- A bear breakout below 111.00 would invalidate the bullish bias.
Spot rate: 111.48
Relative change: 0.26%
High: 111.58
Low: 111.11
Main trend: Bullish
Resistance 1: 112.00-112.15 zone, figure and August 1, swing high
Resistance 2: 112.40 supply level
Resistance 3: 113.18, 2018 high
Support 1: 111.54-111.64 area, August 6, high and supply/demand level
Support 2: 111.45 August 8 high
Support 3: 111.00 figure
Support 4: 110.75, July 23 low
