“¢ The pair extended its consolidative price action within two converging trend-lines, forming a symmetrical triangle on the 1-hourly chart.
“¢ The fact that bulls, over the past 24-hours or so, have shown resilience below 100-hour SMA support and thus, support prospects for a bullish break-out.
“¢ Positive technical indicators on the 1-hourly chart further add credence to the bullish outlook, albeit traders are likely to wait for the release of prelim US Q2 GDP growth figures.
USD/JPY 1-hourly chart
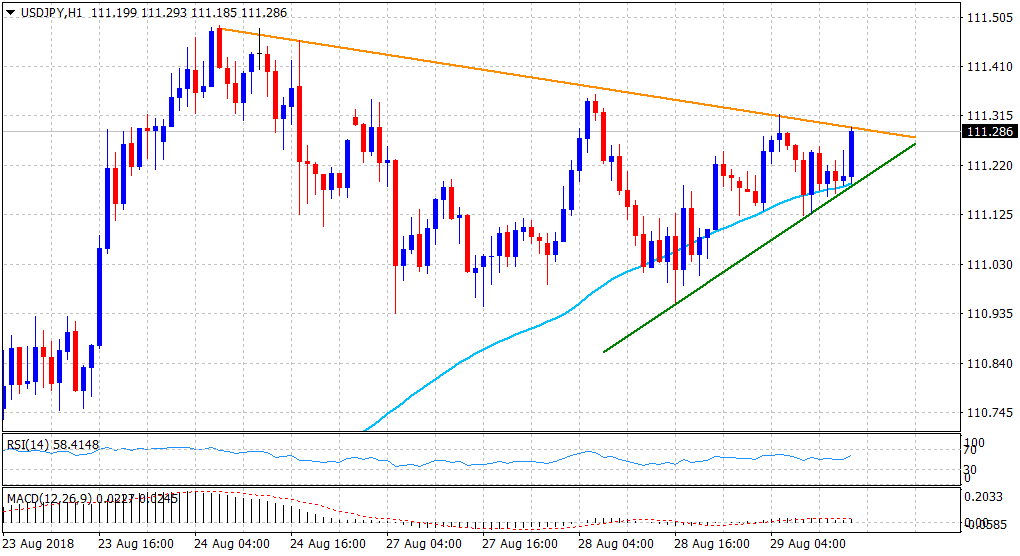
Spot Rate: 111.29
Daily Low: 111.12
Trend: Turning bullish
Resistance
R1: 111.49 (last Friday’s swing high)
R2: 111.80 (R3 daily pivot-point)
R3: 112.00 (round figure mark)
Support
S1: 110.94 (weekly low set on Monday)
S2: 110.76 (S2 daily pivot-point)
S3: 110.20 (100-day SMA)
