“¢ The precious metal has been finding support near the key $1200 psychological mark but the up-move remains capped at a short-term descending trend-line resistance.
“¢ The range-bound price action constitutes towards formation on a descending triangle on the 30-min. chart, suggesting an extension of this week’s retracement from over two-week tops.
“¢ However, technical indicators on hourly and daily charts hold in neutral territory and have failed to support any firm directional bias.
“¢ Hence, it would be prudent to wait for a convincing break in either direction before traders start positioning for any short-term momentum.
Gold 30-min. chart
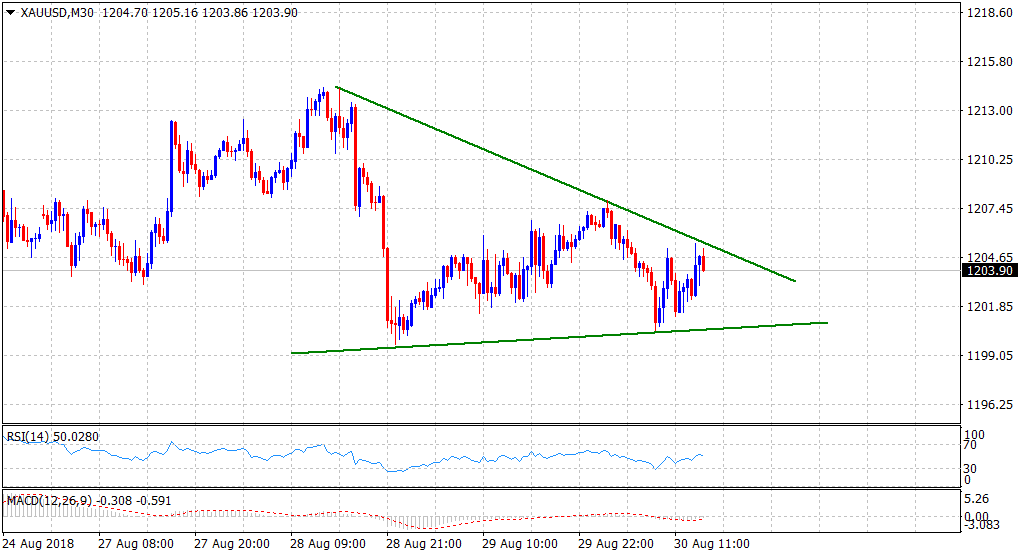
Spot Rate: $1203.90
Daily High: $1207.90
Daily Low: $1200.47
Trend: Bearish only below $1200 mark
Resistance
R1: $1207.90 (descending triangle hurdle)
R2: $1211.75 (R2 daily pivot-point)
R3: $1214.32 (over 2-week high set on Tuesday)
Support
S1: $1200 (psychological round figure mark)
S2: $1196.41 (20-day SMA)
S3: $1192.60 (horizontal zone)
