- USD/JPY is erasing the gains made in the last 24 hours. It is currently also supported by the 50-day simple moving average.
- The bears are creating a double top with August 1 and 110.00 is now the bears’ target.
- A bull breakout above 112.00 would invalidate the bearish bias.
USD/JPY daily chart
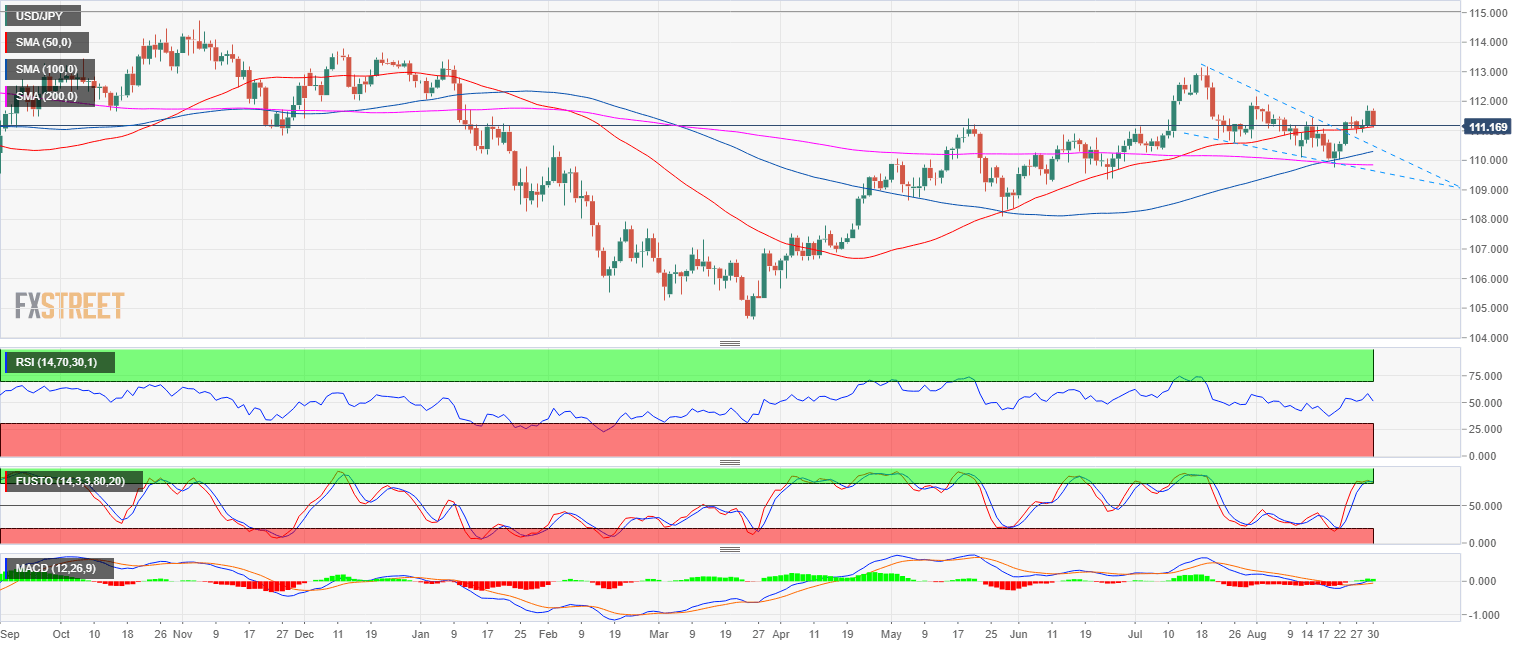
Spot rate: 111.17
Relative change: -0.45%
High: 111.77
Low: 111.12
Main trend: Bullish
Short-term trend: Bearish below 112.00
Resistance 1: 111.45 August 8 high
Resistance 2: 111.54-111.64 area, August 6, high and supply/demand level
Resistance 3: 112.00-112.15 zone, figure and August 1, swing high
Resistance 4: 112.40 supply level
Resistance 5: 113.18, 2018 high
Support 1: 111.00 figure
Support 2: 110.75, July 23 low
Support 3: 110.00 figure
