- The bearish divergence of the hourly chart RSI failed to yield a notable correction, which is usually the case in a strong bullish market.
- The 5-day and 10-day moving averages (MAs) are rising, meaning the path of least resistance is on the higher side.
- USD/TRY looks set to test 6.55 (61.8 percent Fibonacci retracement of 7.0831/5.6889.
Hourly Chart
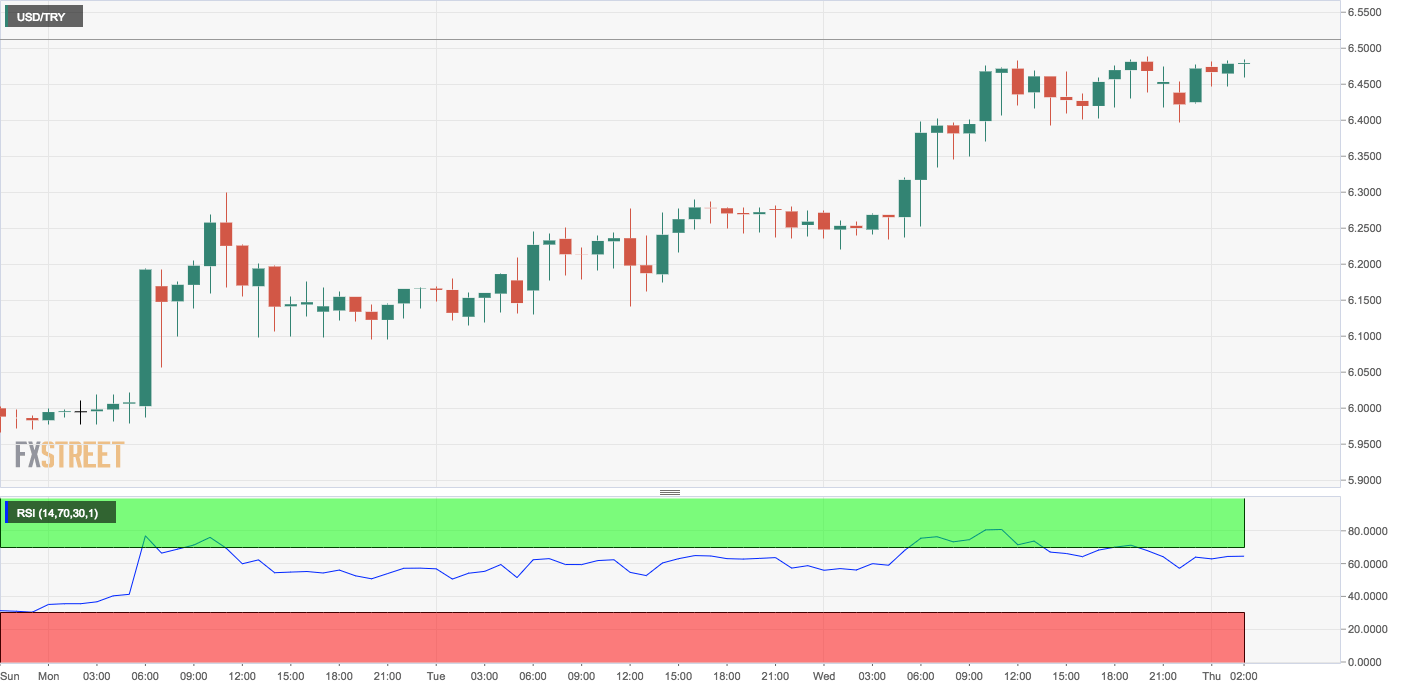
Spot Rate: 6.4765
Daily High: 6.4768
Daily Low: 6.4111
Trend: Bullish
R1: 6.55 (61.8% Fib)
R2: 6.7847 (78.6% Fib)
R3: 7.083 (recent high
Support
S1: 6.3398 (Aug. 17 high)
S2: 6.2616 (5-day MA)
S3: 6.16 (10-day MA)
