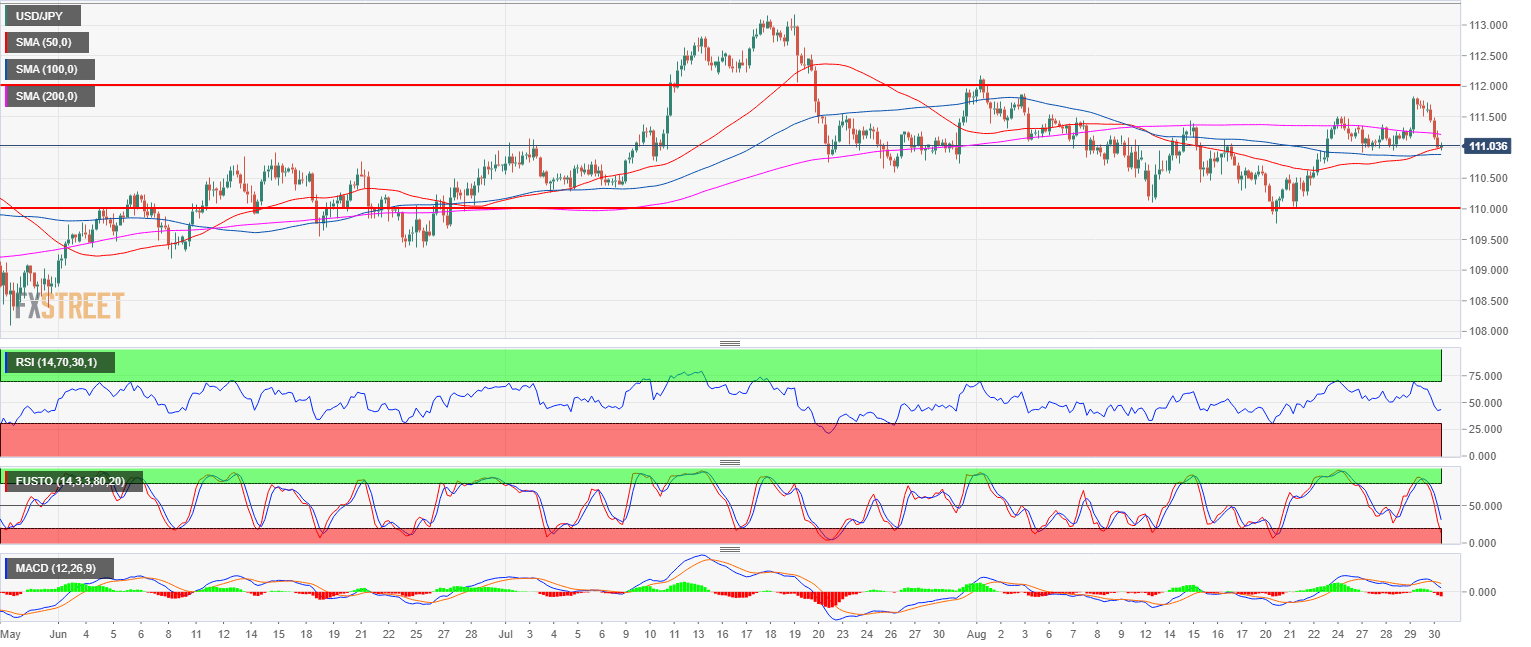
- USD/JPY failed to break above 112.00 figure and created a double top with August 1 peak.
- The 50, 100 and 200-period simple moving averages are trading relatively flat on the 4-hour chart suggesting the market is range bound. The RSI, the Stochastics Oscillator and the MACD are in negative territories suggesting that the risk is skewed to the downside with 110.00 as main target.
- A bull breakout above 112.00 would invalidate the bearish bias.
Spot rate: 111.05
Relative change: 0.05%
High: 111.08
Low: 110.95
Main trend: Bullish
Short-term trend: Bearish below 112.00
Resistance 1: 111.45 August 8 high
Resistance 2: 111.54-111.64 area, August 6, high and supply/demand level
Resistance 3: 112.00-112.15 zone, figure and August 1, swing high
Resistance 4: 112.40 supply level
Resistance 5: 113.18, 2018 high
Support 1: 111.00 figure
Support 2: 110.75, July 23 low
Support 3: 110.00 figure
