- USD/JPY is finding some buying interest near 110.75 support.
- USD/JPY is trying to resume the bull leg of the last days by finding support just above the 61.8% Fibonacci retracement level of the August 20-29 bull move. However, given the flat simple moving averages, it is likely that the market remains sideways in the coming sessions.
- A bear breakout below 110.50 would invalidate the bullish bias.
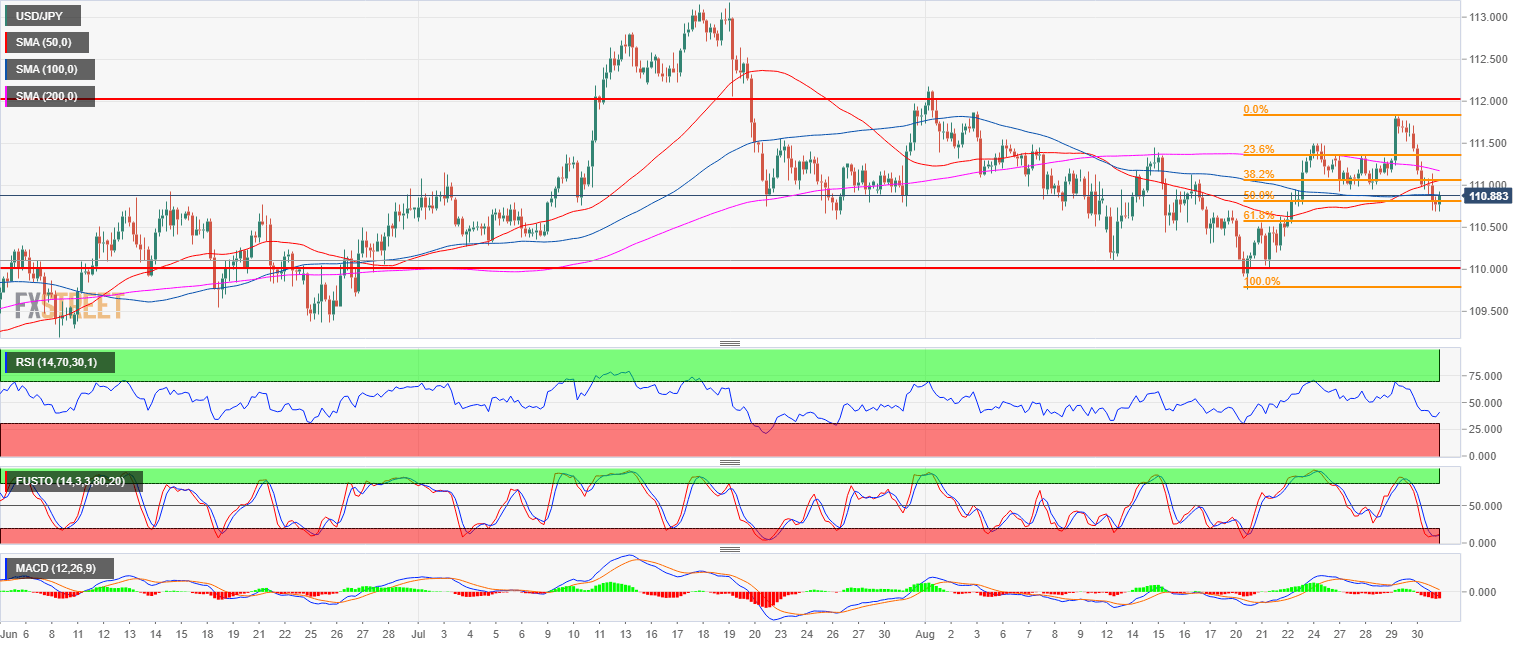
Spot rate: 110.85
Relative change: -0.11%
High: 111.14
Low: 110.68
Main trend: Bullish
Resistance 1: 111.00 figure
Resistance 2: 111.45 August 8 high
Resistance 3: 111.54-111.64 area, August 6, high and supply/demand level
Resistance 4: 112.00-112.15 zone, figure and August 1, swing high
Resistance 5: 112.40 supply level
Resistance 6: 113.18, 2018 high
Support 1: 110.75, July 23 low
Support 2: 110.00 figure
Support 3: 109.37 June 25 low
