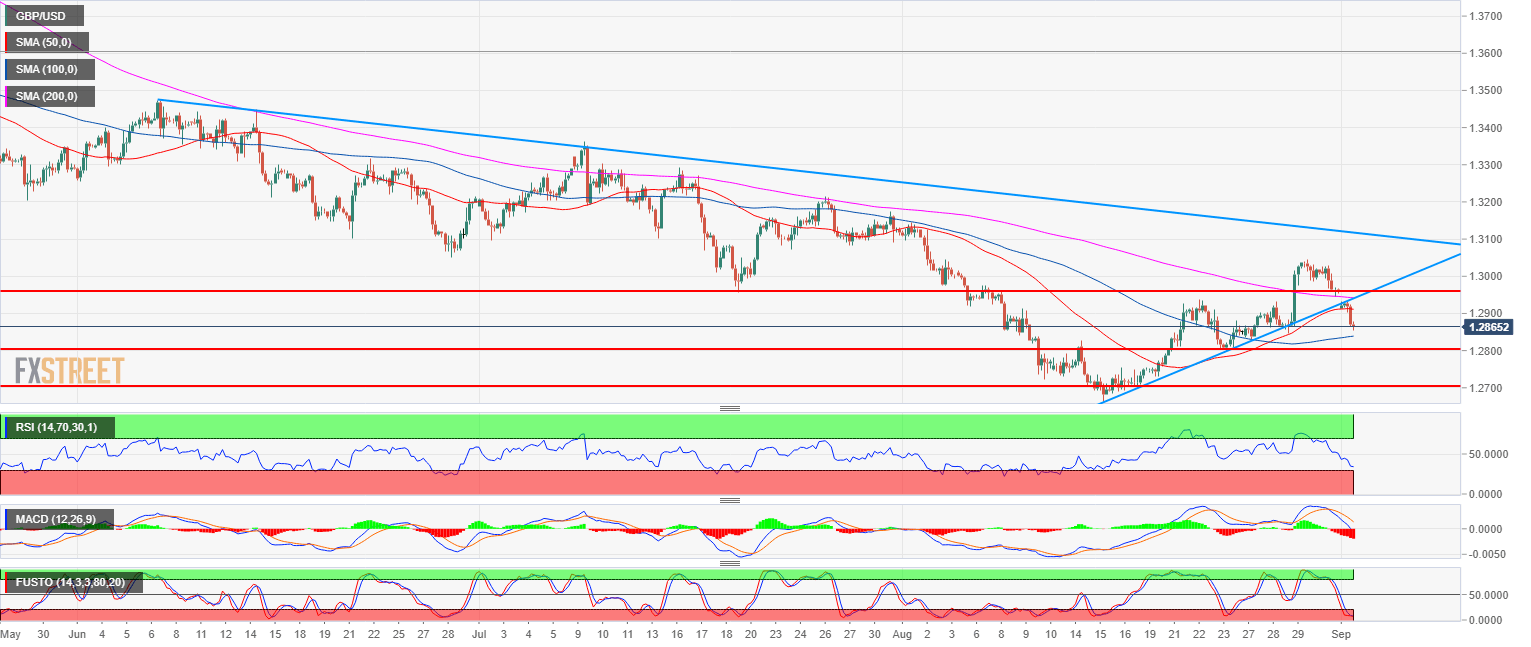
- GBP/USD bears are keeping the main trend intact as Cable is trading below the 200-period simple moving average on the 4-hour chart.
- GBP/USD broke below the bull trendline along with the 50-period simple moving average (4-hour chart). The RSI, Stochastics and MACD indicators are all bearishly configured suggesting a strong bearish momentum.
- The next major target to the downside is located near 1.2800 swing low. A bull breakout above 1.3050 would invalidate the bearish bias.
GBP/USD 4-hour chart
Spot rate: 1.2864
Relative change: -0.73%
High: 1.2935
Low: 1.2855
Main trend: Bearish below 1.3050
Resistance 1: 1.2868 August 22 low
Resistance 2: 1.2900 figure
Resistance 3: 1.2937 August 22 swing high
Resistance 4: 1.2957 July 19 swing low
Resistance 5: 1.3000 figure
Support 1: 1.2838, August 10 high
Support 2: 1.2800 swing low
Support 3: 1.2700-1.2723 zone, figure and August 10 low
