“¢ The pair showed some resilience below the 111.00 handle and once again managed to catch some bids near a short-term falling channel resistance break-point.
“¢ However, mixed technical indicators on the 4-hourly chart haven’t been supportive of the pair’s uptick of around 30-pips from an intraday low level of 110.85.
“¢ Hence, it would be prudent to wait for a follow-through momentum beyond last week’s swing, around the 111.80-85 region, before positioning for any further up-move.
“¢ Alternatively, a convincing break below the resistance turned support might turn the pair vulnerable to head back towards testing August monthly lows, sub-110.00 level.
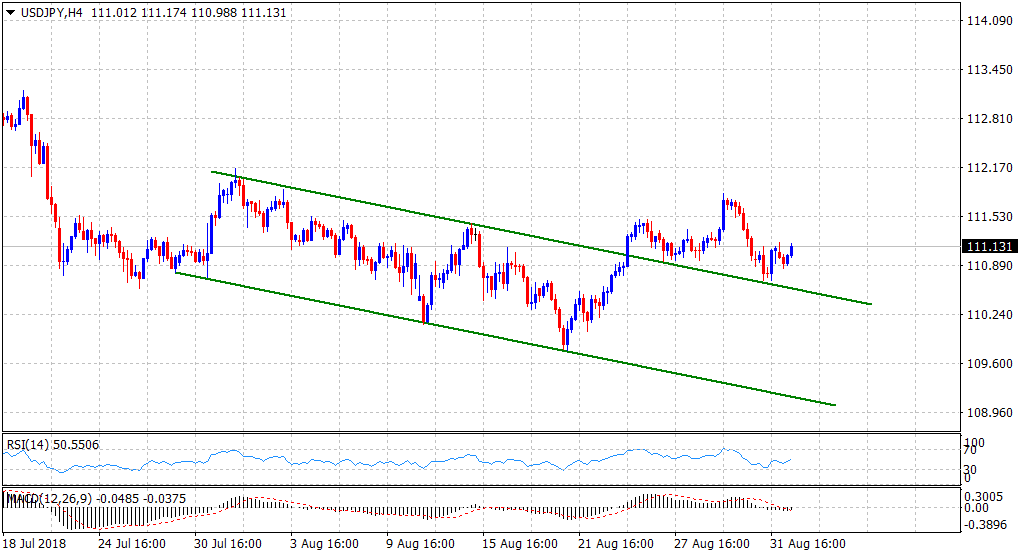
Spot Rate: 111.13
Daily Low: 110.85
Trend: Bullish until holds above Friday’s over one-week low
Resistance
R1: 111.40 (horizontal zone)
R2: 111.73 (R3 daily pivot-point)
R3: 112.00 (round figure mark)
Support
S1: 110.85 (current day swing low)
S2: 110.53 (S2 daily pivot-point)
S3: 110.32 (100-day SMA)
