- Crude oil bears didn’t play with pocket money as they managed to reverse the last three days of trading creating a big red bar on the chart.
- Investors are exiting their long positions as the rising wedge is breaking to the downside, leaving bulls virtually no choice but to sell their positions.
- Now that the market strongly rejected the 70.00 and 71.00 figure, the next main support to the downside is located near the 68.00 figure.
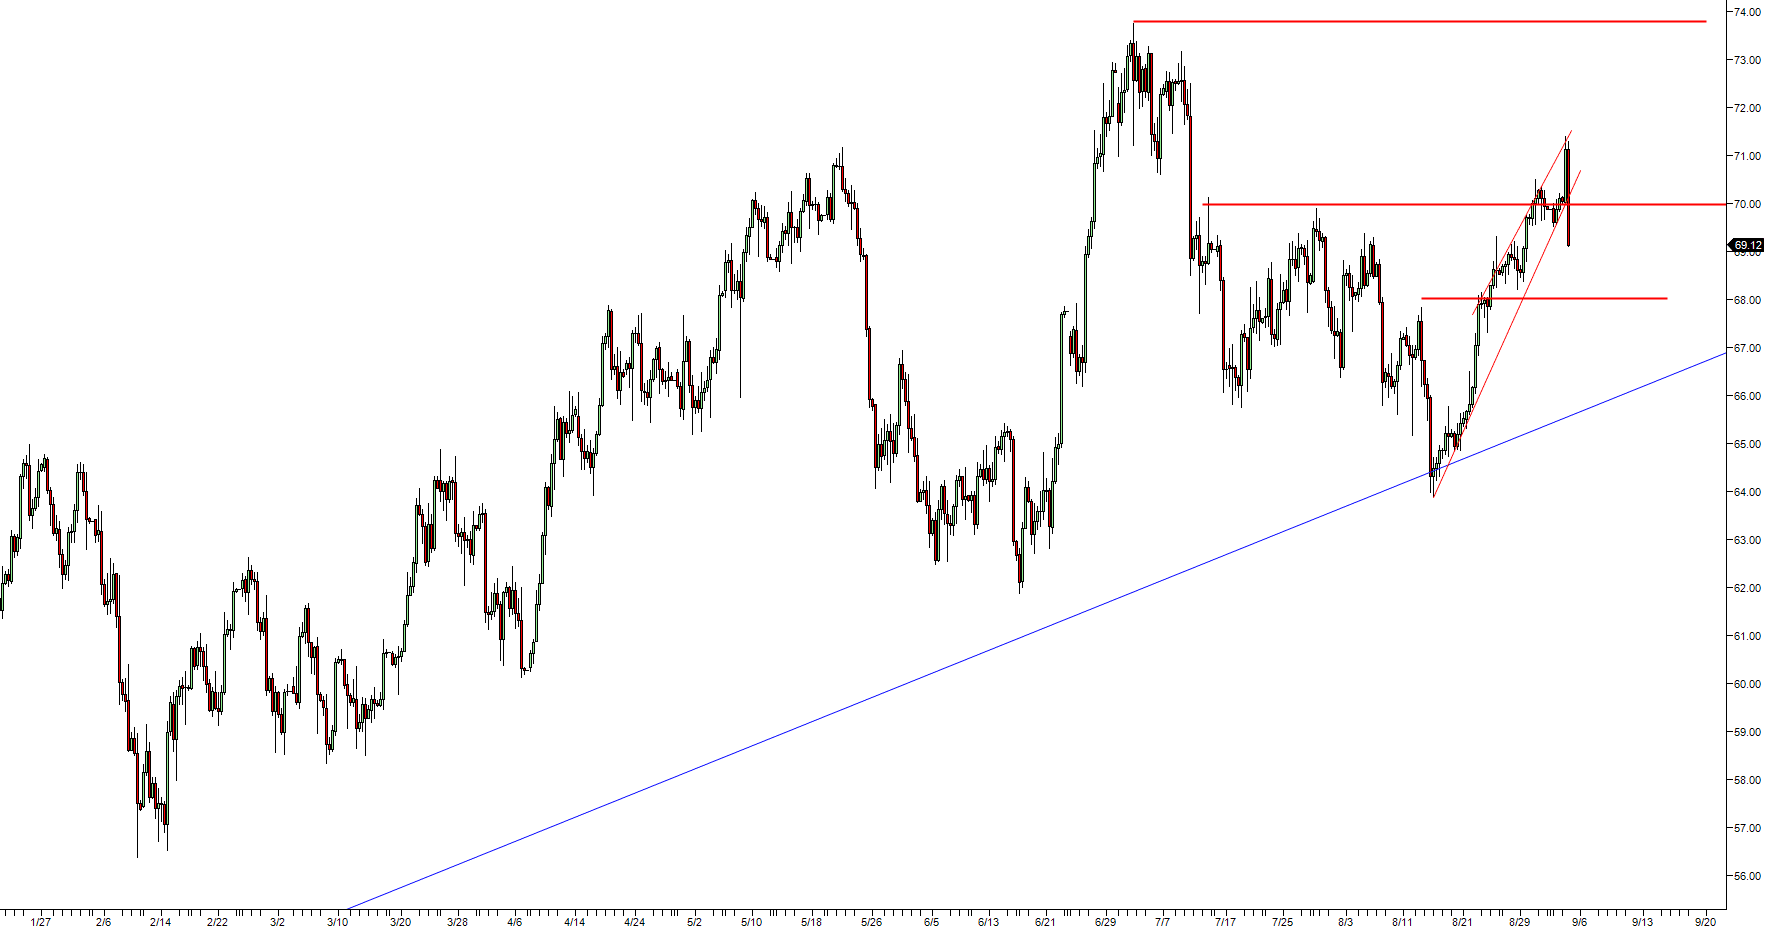
Spot rate: 69.20
Relative change: -1.21%
High: 71.37
Low: 69.05
Main Trend: Bullish
Short-term trend: Bearish below 70.00
Resistance 1: 69.44 June 25 high
Resistance 2: 70.00 figure
Resistance 3: 70.53 May 24 low
Resistance 4: 71.19 May 23 low
Resistance 5: 72.13 July 6 low
Support 1: 69.30 August 24 high
Support 2: 69.00 figure
Support 3: 68.00-68.30 zone, figure and supply/demand level
