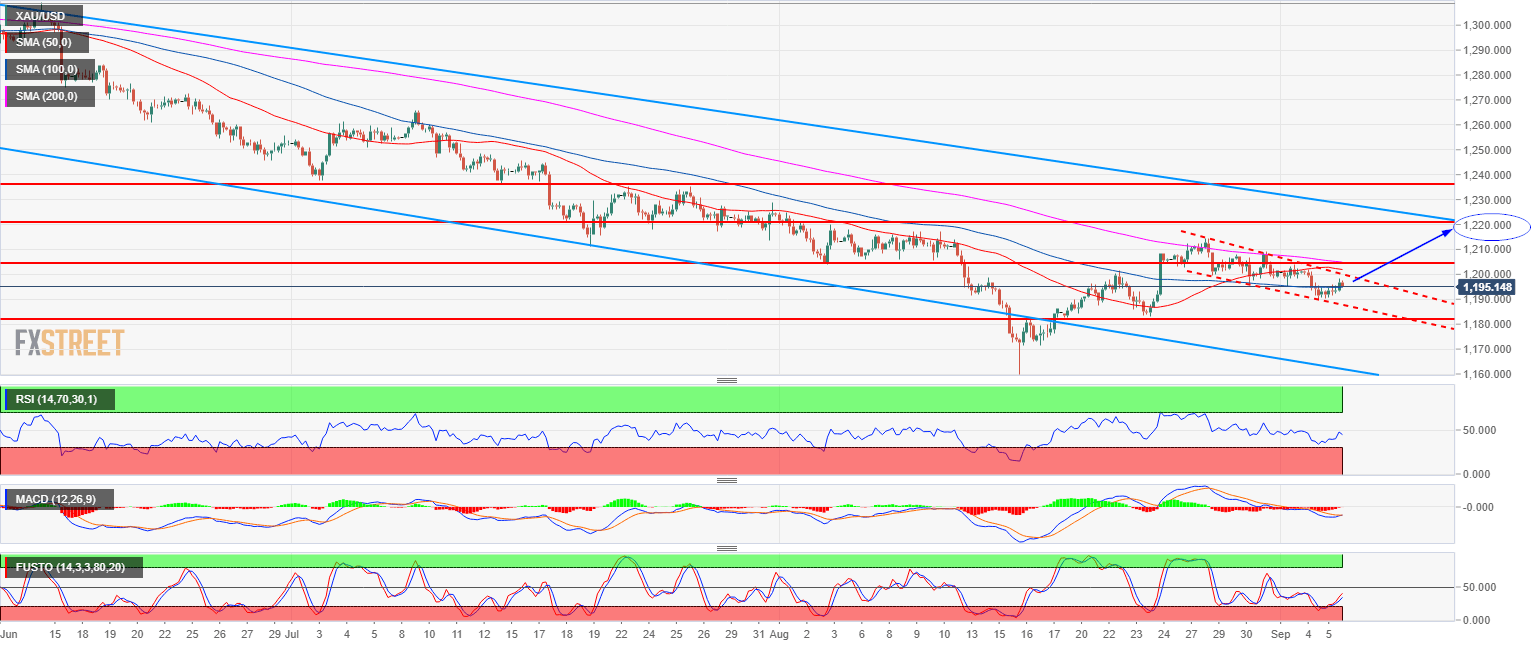
- Gold bear trend has been losing steam in the last two weeks as the market has found a bottom at 1,172.82.
- Gold is evolving in a bull flag. The market is also coiling around a flat 100-period simple moving average on the 4-hour chart while the RSI, MACD and Full Stochastics indicators are all gaining bullish traction suggesting higher prices ahead.
- A bear breakout below 1,182.90 August 24 low would invalidate the bullish bias.
Spot rate: 1,195.67
Relative change: 0.37%
High: 1,198.41
Low: 1,190.60
Trend: Bearish
Short-term trend: Bullish above 1,182.90
Resistance 1: 1,194.30 March 10, 2017 low
Resistance 2: 1,204.10, August 3 swing low (key level)
Resistance 3: 1,211.17 July 19 low
Resistance 4: 1,213.70 July 31 low
Resistance 5: 1,217.89-1,220.90 zone, August 6 high and July 18 low
Resistance 6: 1,225.90 July 17 low
Support 1: 1,182.90 August 24 low
Support 2: 1,172.82 current 2018 low
Support 3: 1,145.20 March, 1 2017 low
