- USD/JPY bulls are eager to resume the main bull trend.
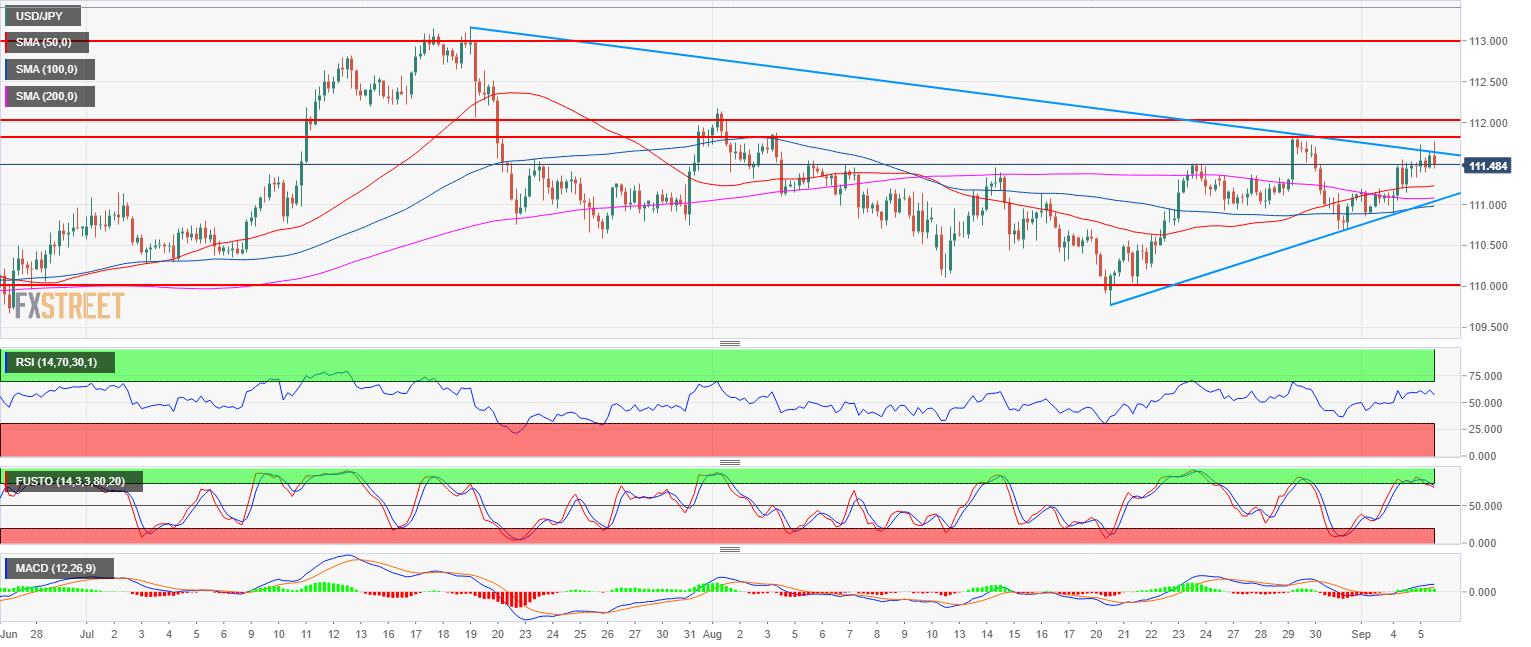
- USD/JPY is trading above its main simple moving averages (bullish) but below a bear trendline capping for the time being the bullish advance. USD/JPY is also printing a small double top with August 29 swing high at the 111.84 level
- If bulls are unable to break through the 111.84 resistance the market might pullback towards the 111.00 level.
Spot rate: 111.47
Relative change: 0.08%
High: 111.77
Low: 111.33
Main trend: Bullish
Resistance 1: 111.45 August 8 high
Resistance 2: 111.54 August 6, high
Resistance 3: 111.84 August 29 swing high
Resistance 4: 112.00-112.15 zone, figure and August 1, swing high
Resistance 5: 112.40 supply level
Resistance 6: 113.18, 2018 high
Support 1: 111.00 figure
Support 2: 110.75, July 23 low
Support 3: 110.00 figure
Support 4: 109.37 June 25 low
