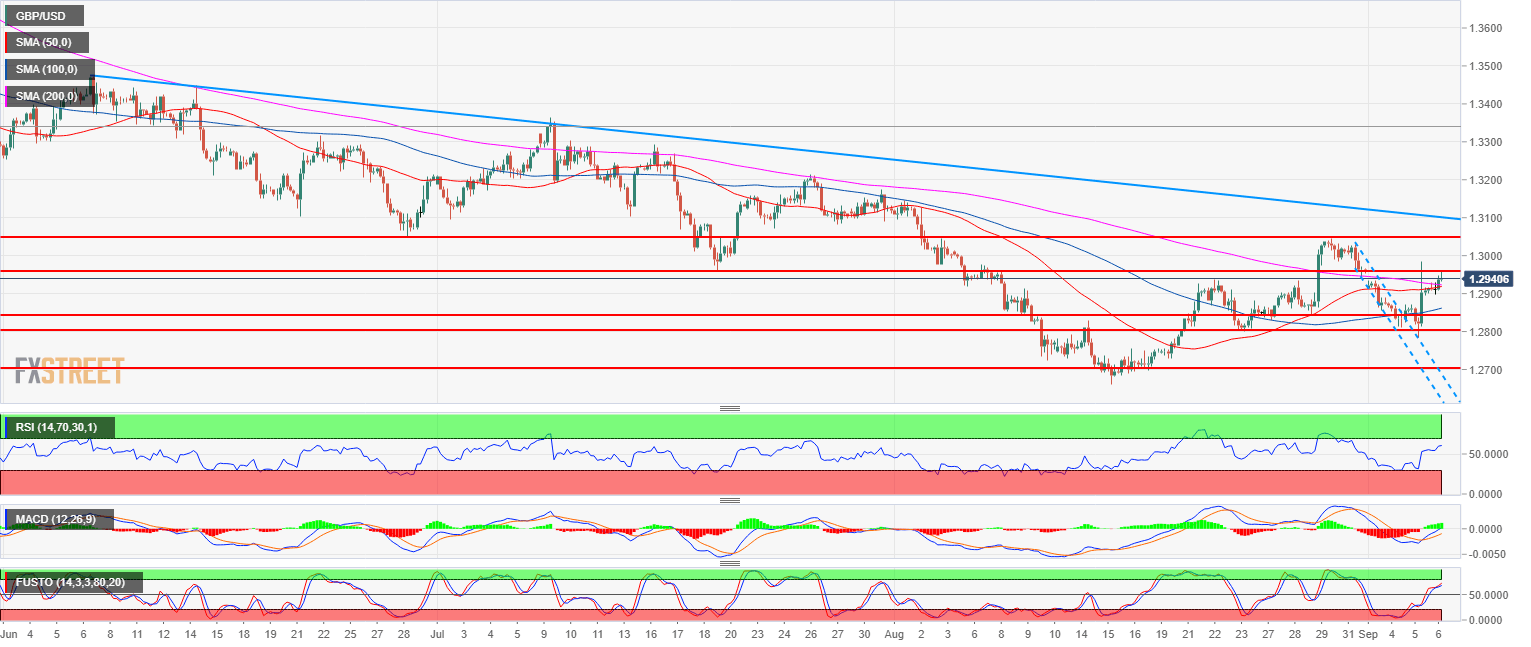
- GBP/USD main bear trend is on hold since mid-August.
- The 50-period simple moving average (SMA) broke above the 100 SMA which are both slightly ticking upward while the RSI, MACD and Stochastics indicators are bullishly configured.
- The next resistance to overcome is 1.2957 after which 1.3050 become the next bastion for sellers to defend the bear trend. A bear breakout below 1.2800 (August 24 swing low) would invalidate the bullish bias.
GBP/USD 4-hour chart
Spot rate: 1.2938
Relative change: 0.23%
High: 1.2961
Low: 1.2896
Main trend: Bearish
Short-term trend: Bullish above 1.2800
Resistance 1: 1.2957 July 19 swing low
Resistance 2: 1.3000 figure
Resistance 3: 1.3050 August 30 swing high, key level
Resistance 4: 1.3082-1.3100 supply/demand level and figure
Support 1: 1.2937 August 22 swing high
Support 2: 1.2900 figure
Support 3: 1.2868 August 22 low
Support 4: 1.2845, August 29 low
Support 5: 1.2800 August 24 swing low
