- The Kiwi is bouncing in early Asia trading as the US Dollar recedes across the broader markets.
- Risk appetite is seeing an attempt at recovery for the last half of the week, helping to kick the Kiwi back up off of 30-month lows.
- Antipodean markets have been on weaker footing as trade tensions surrounding China continue to build.
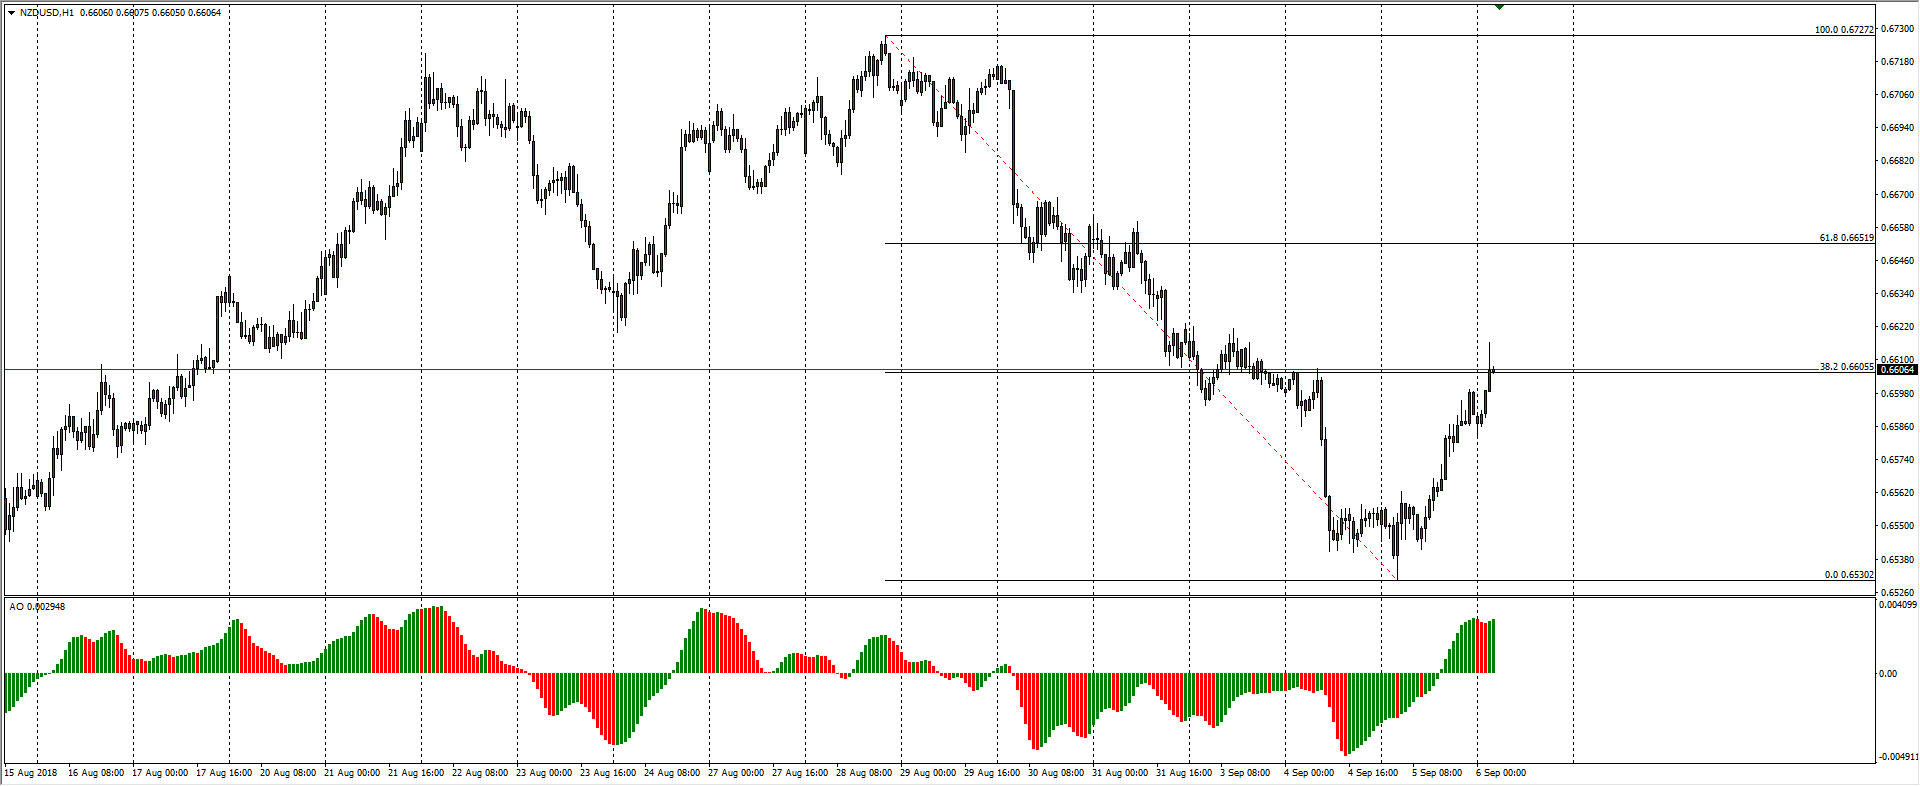
| Spot rate: | 0.6606 |
| Relative change: | 0.25% |
| High: | 0.6616 |
| Low: | 0.6582 |
| Trend: | Bullish correction |
| Support 1: | 0.6582 (current day low) |
| Support 2: | 0.6530 (major technical bottom, 2018 low) |
| Support 3: | 0.6500 (major technical level) |
| Resistance 1: | 0.6621 (current week high) |
| Resistance 2: | 0.6651 (61.8% one-week Fibo level) |
| Resistance 3: | 0.6727 (previous week high) |
