“¢ The pair struggled to build on overnight recovery from 31-month lows and was seen oscillating between 23.6% and 38.2% Fibonacci retracement level of the 0.6727-0.6530 recent fall.
“¢ Meanwhile, positive technical indicators on the 1-hourly chart seemed to suggest that bullish traders might be in the process of forming a strong base around 100-hour SMA.
A convincing break through the 0.6600 handle would reinforce the expectations and pave the way for “¢an extension of the near-term short-covering move.
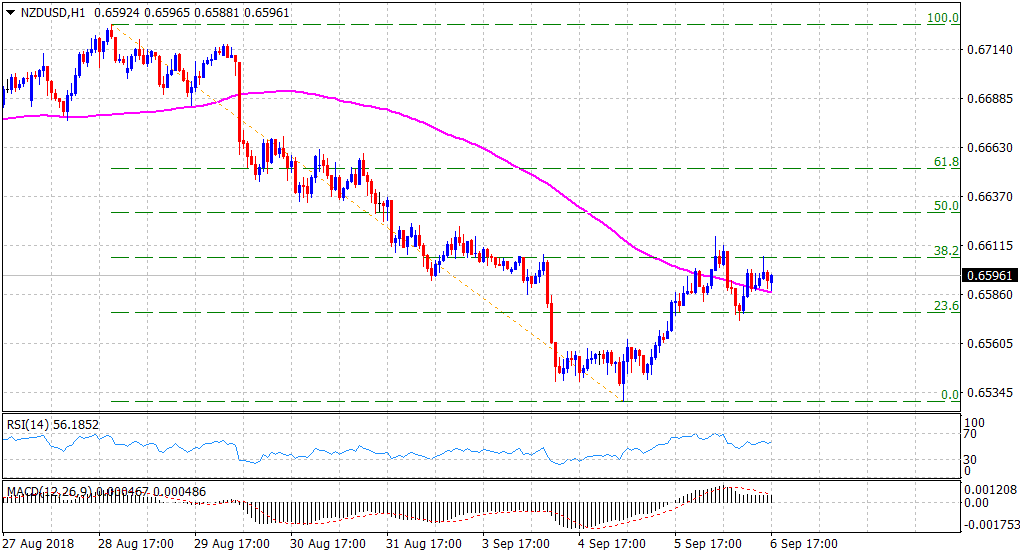
Spot Rate: 0.6596
Daily Low: 0.6572
Daily High: 0.6616
Trend: Short-term bullish
Resistance
R1: 0.6616 (current day swing high)
R2: 0.6638 (100-period SMA H4)
R3: 0.6691 (R3 daily pivot-point)
Support
S1: 0.6572 (current day swing low)
S2: 0.6552 (recent daily closing low)
S3: 0.6530 (31-month low set in the previous session)
