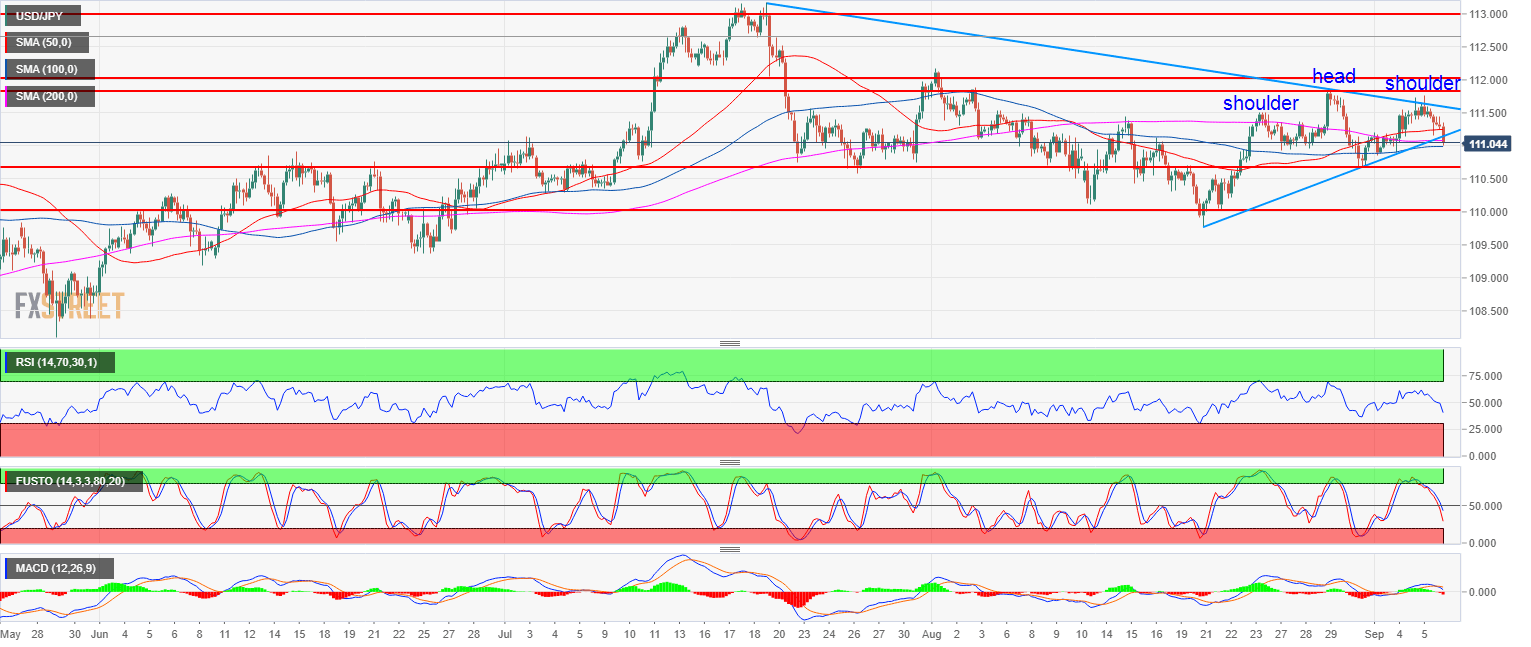
- USD/JPY bull trend is on hold as the market created a head-and-shoulder pattern.
- USD/JPY is breaking below the bull trendline while the RSI, MACD and Stochastics indicators are bearishly configured. Bulls will try to support the market at the 100-period simple moving average and the 111.00 figure but at this stage, the market seems to be set for a retest of the 110.75 (July 23 swing low) and possible 110.00 figure.
- A bull breakout above 111.84 August 29 swing high would invalidate the bearish bias.
Spot rate: 111.03
Relative change: -0.47%
High: 111.55
Low: 110.99
Main trend: Bullish
Short-term trend: Bearish
Resistance 1: 111.45 August 8 high
Resistance 2: 111.54 August 6, high
Resistance 3: 111.84 August 29 swing high
Resistance 4: 112.00-112.15 zone, figure and August 1, swing high
Resistance 5: 112.40 supply level
Resistance 6: 113.18, 2018 high
Support 1: 111.00 figure
Support 2: 110.75, July 23 swing low
Support 3: 110.00 figure
Support 4: 109.37 June 25 low
