- Crude oil bulls are eager to resume the main bear trend.
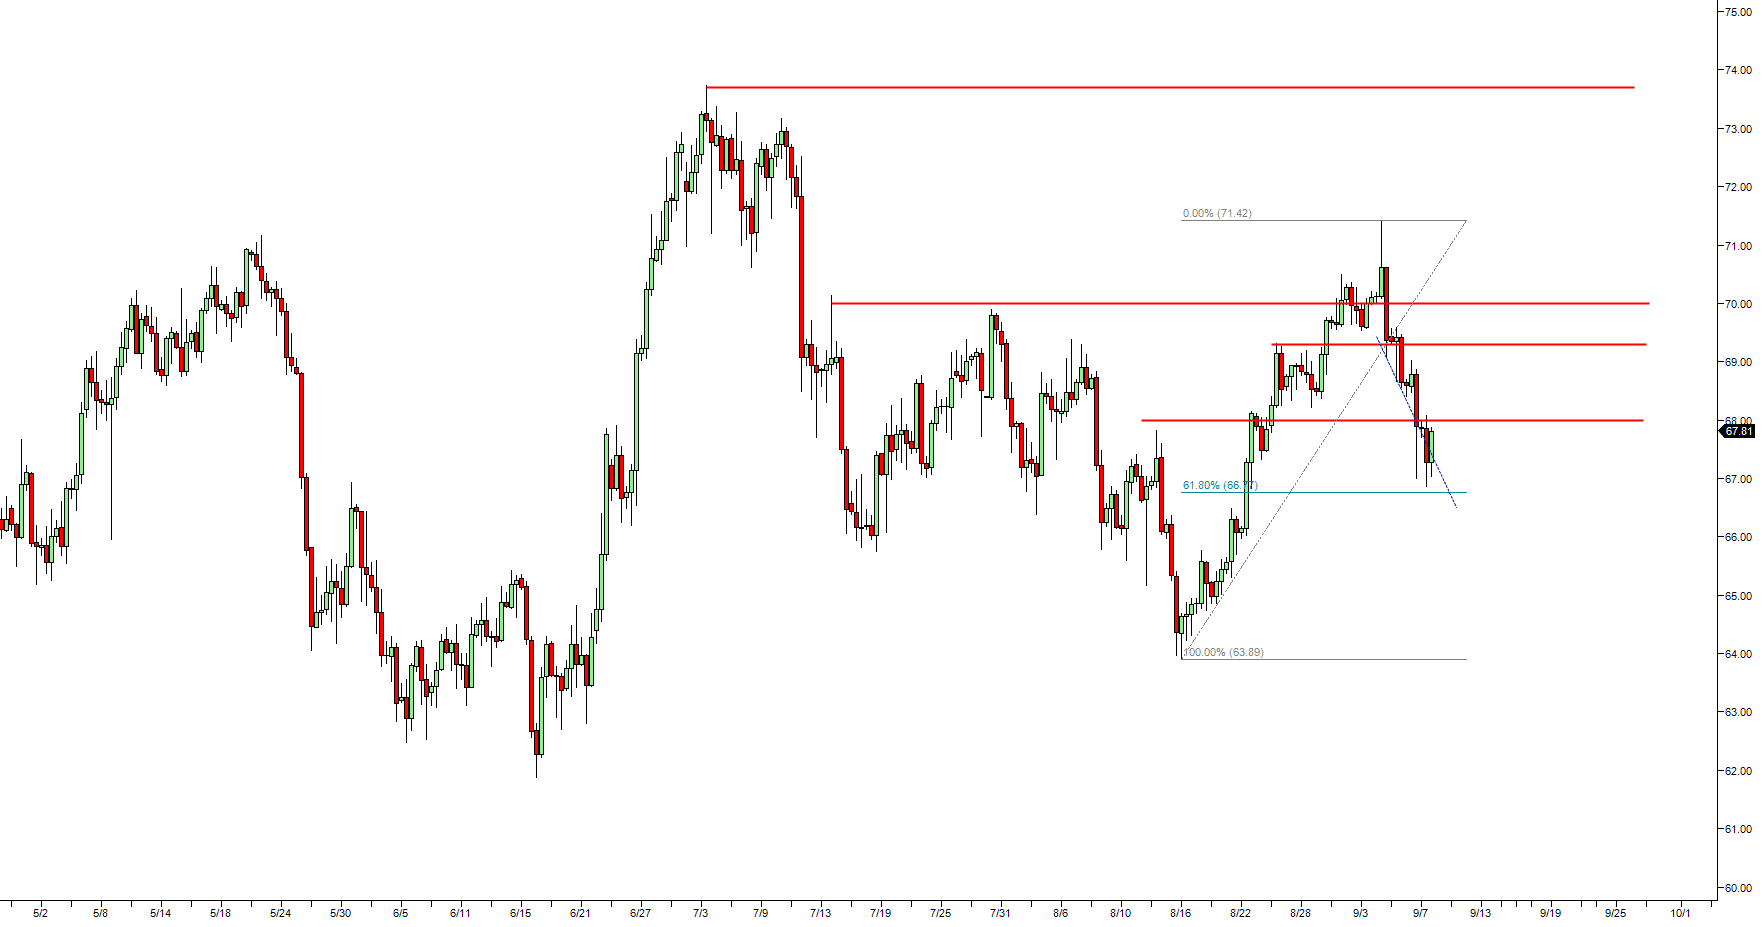
- Bulls found support just above the 61.8% Fibonacci retracement level from the mid-August to early-September bull move. The market overshot the bear trendline (blue) and created a sell-climax in the process suggesting that the market went too far too fast.
- The target to the upside is located near 69.30 August 24 high
Crude oil WTI 480-minute chart
Spot rate: 67.74
Relative change: 0.37%
High: 68.09
Low: 66.86
Main Trend: Bullish
Resistance 1: 68.00-68.30 zone, figure and supply/demand level
Resistance 2: 69.00 figure.
Resistance 3: 69.30 August 24 high
Resistance 4: 69.44 June 25 high
Resistance 5: 70.00 figure
Resistance 6: 70.53 May 24 low
Support 1: 67.84 August 14 swing high
Support 2: 67.16 June 14 high
Support 3: 67.72 June 26 low
