- The rising wedge breakdown, a bearish pattern, seen in the USD/CAD 15-minute chart has opened the doors to a sell-off towards 1.3025 (target as per the measured height method).
- On the way lower, the pair may encounter support at 1.3092 – trendline sloping downwards from the June 27 low and July 20 low.
- The bullish outlook put forward by the falling channel breakout would be aborted if the currency pair closes below 1.301 (back inside the falling channel.
15-minute chart
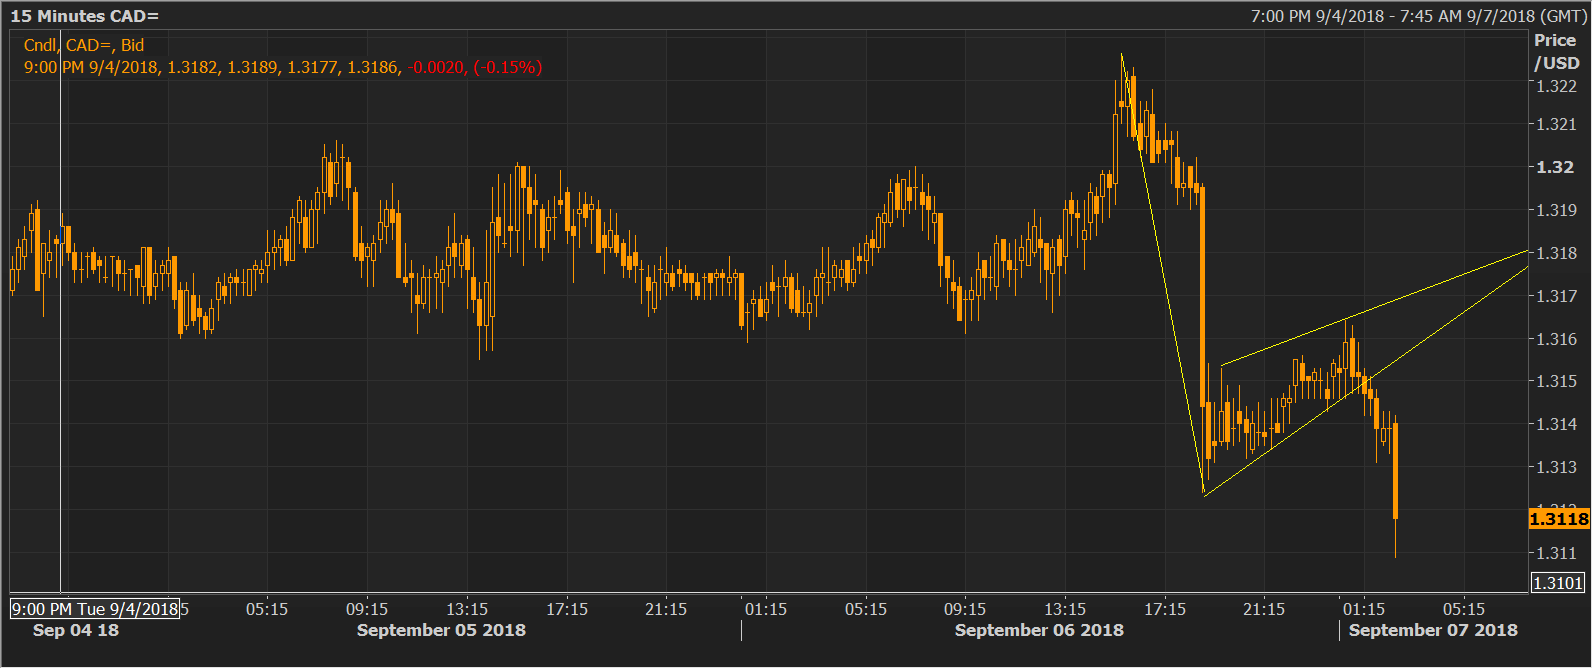
Spot Rate: 1.3117
Daily High: 1.3166
Daily Low: 1.3113
Trend: Bearish
R1: 1.3143 (ascending 5-day moving average)
R2: 1.3175 (Aug. 15 high)
R3: 1.32 (psychological hurdle)
Support
S1: 1.3088 (50-day moving average)
S2: 1.3057 (50% Fib R of 1.2887/1.3226)
S3: 1.3017 (61.8% Fib R of 1.2887/1.3226)
