- The GBP/JPY remains trapped in the middle after last week’s risk recovery on improving Brexit hopes came up against broad-market trade tensions, and risk appetite continues to hang in the middle.
- Last week’s range trap keeps the Guppy spiraling near the 200-hour EMA as markets await a broader push.
- Declining highs on higher timeframes are setting up for a descending triangle pattern.
GBP/JPY Chart, 1-Hour
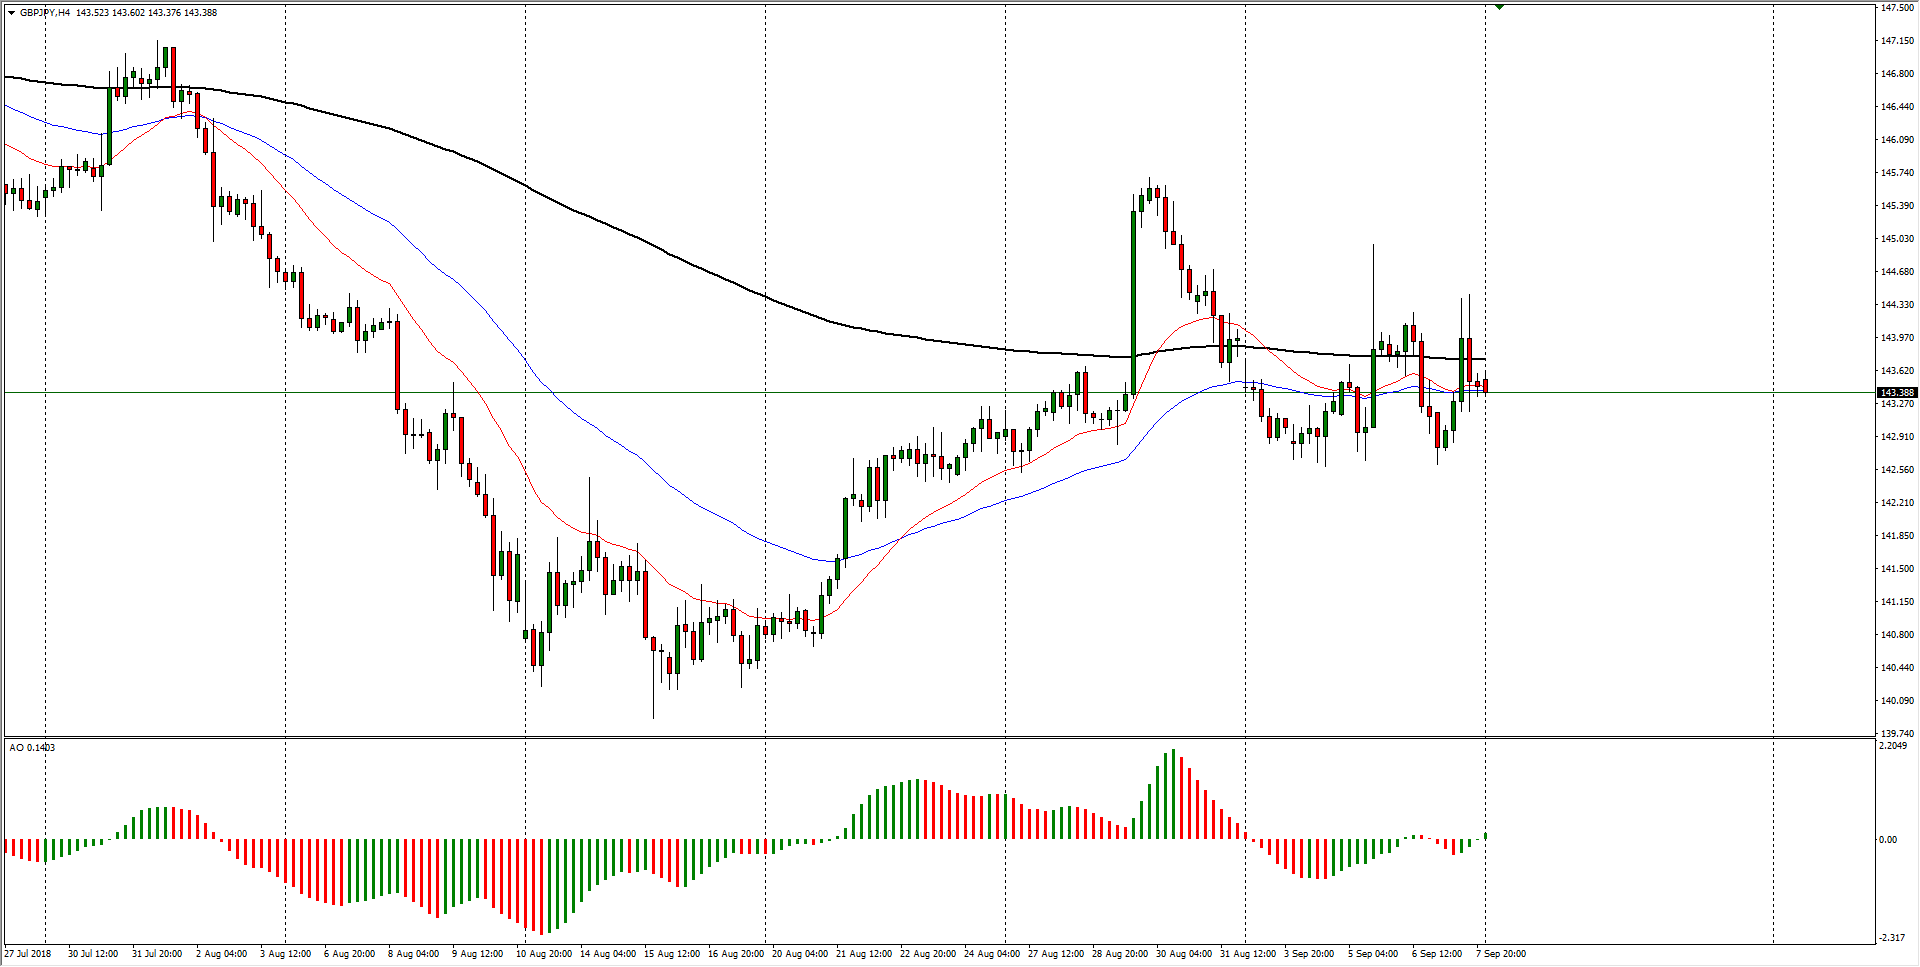
| Spot rate: | 143.38 |
| Relative change: | -0.06% |
| High: | 143.60 |
| Low: | 143.40 |
| Trend: | Sideways |
| Support 1: | 142.70 (previous week major support zone) |
| Support 2: | 142.00 (major technical level) |
| Support 3: | 139.89 (2018 major technical bottom) |
| Resistance 1: | 143.73 (200-period H4 EMA) |
| Resistance 2: | 144.96 (previous week high) |
| Resistance 3: | 145.69 (one-month high) |
