- The oversold status of the currency pair, as per the hourly chart relative strength index (RSI), could yield a minor corrective rally to 0.6559 – 5-day moving average (MA) before further downside unfolds.
- The daily chart, with the downward sloping 5-day and 10-day MAs and RSI at 35, is biased toward the bears. Hence, corrective rallies, if any, will likely be short-lived.
- The Fed is set to hike rates later this month. So, it seems safe to say that the rate differentials are biased toward the NZD-bears. All-in-all, the spot looks set to test the July 2015 low of 0.6498.
Hourly chart
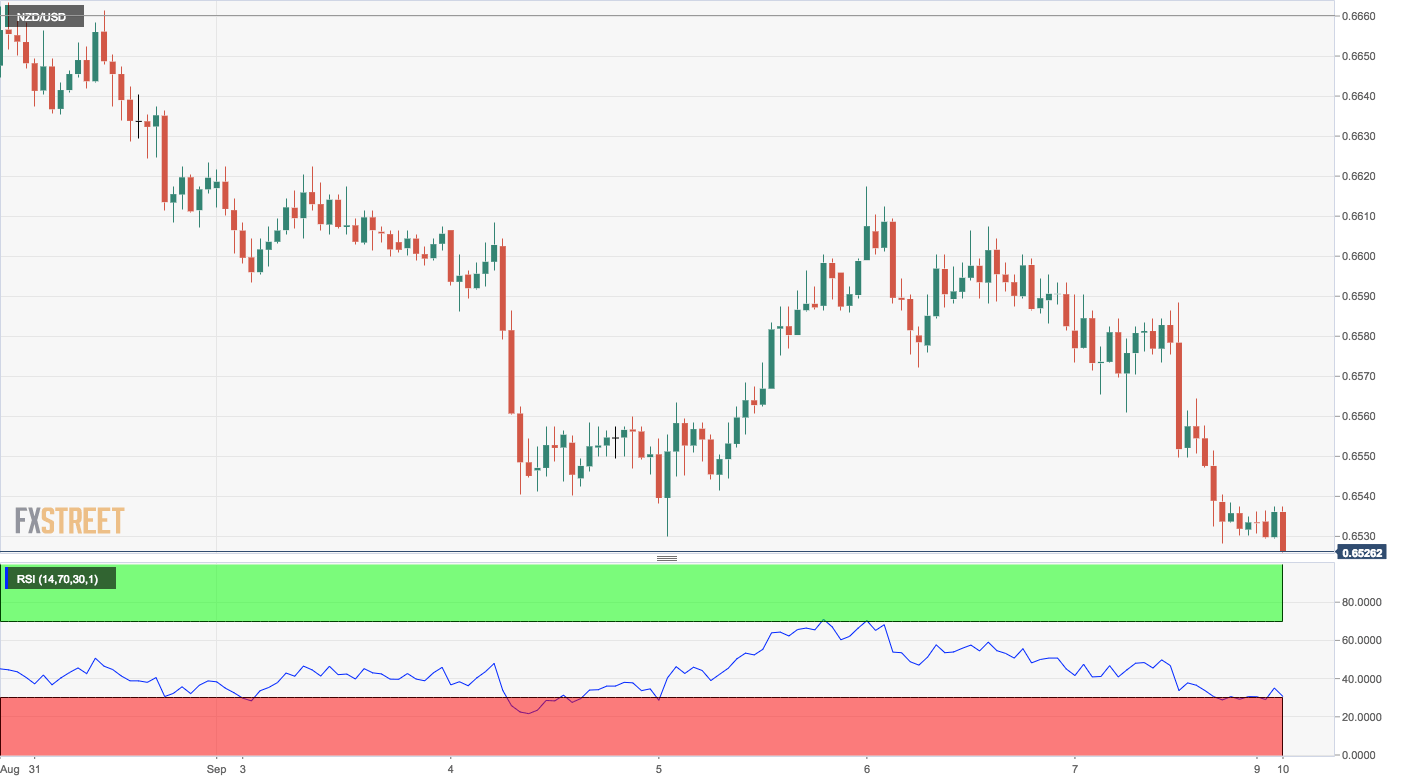
Spot Rate: 0.6530
Daily High: 0.6536
Daily Low: 0.6528
Trend: Dead cat bounce likely
R1: 0.6540 (resistance as per 1H chart)
R2: 0.6559 (5-day MA)
R3: 0.6616 (Sep. 6 high)
Support
S1: 0.6528 (session low)
S2: 0.6498 (July 2015 low)
S3: 0.6428 (Nov. 2015 low)
