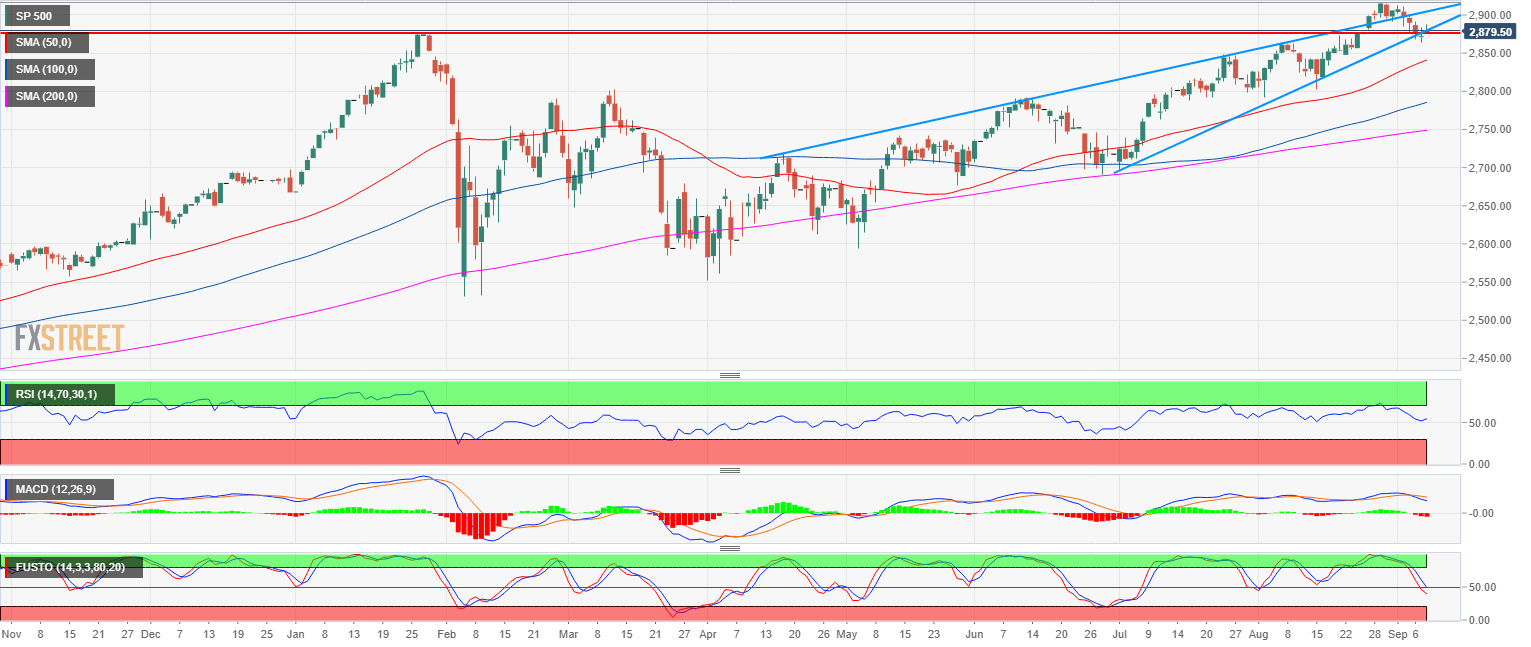
- The S&P500 Index is in consolidation phase after making new all-time-highs in the last weeks.
- The Index is holding above 2,877.00 January swing high and the bull trendline which is rather bullish.
- However, the RSI, MACD and Stochastics indicators are starting to show some sign of weakness and a deeper correction might be just around the corner with 2,853.00 (August 9 low) as support to the downside.
S&P500 daily chart
Spot rate: 2,879.50
Relative change: 0.25%
High: 2,888.00
Low: 2,876.00
Main trend: Bullish
Resistance 1: 2,900.00 figure
Resistance 2: 2,917.00 all-time-high
Resistance 3: 2,930.00 figure
Resistance 4: 2,950.00 figure
Support 1: 2,877.00 January swing high
Support 2: 2,863.75 August 7 high
Support 3: 2,853.00 August 9 low
