- Dollar-Yen pairing spinning near the 111.00 handle as traders await a direction for overall market sentiment heading into the new week.
- A lower swing high on last week’s chart leaves the pair exposed to further downside as trade tensions remain piqued.
- Friday’s NFP report saw a bounce in the USD on stronger wages, and later this week will be seeing inflation figures from the US’ CPI reading.
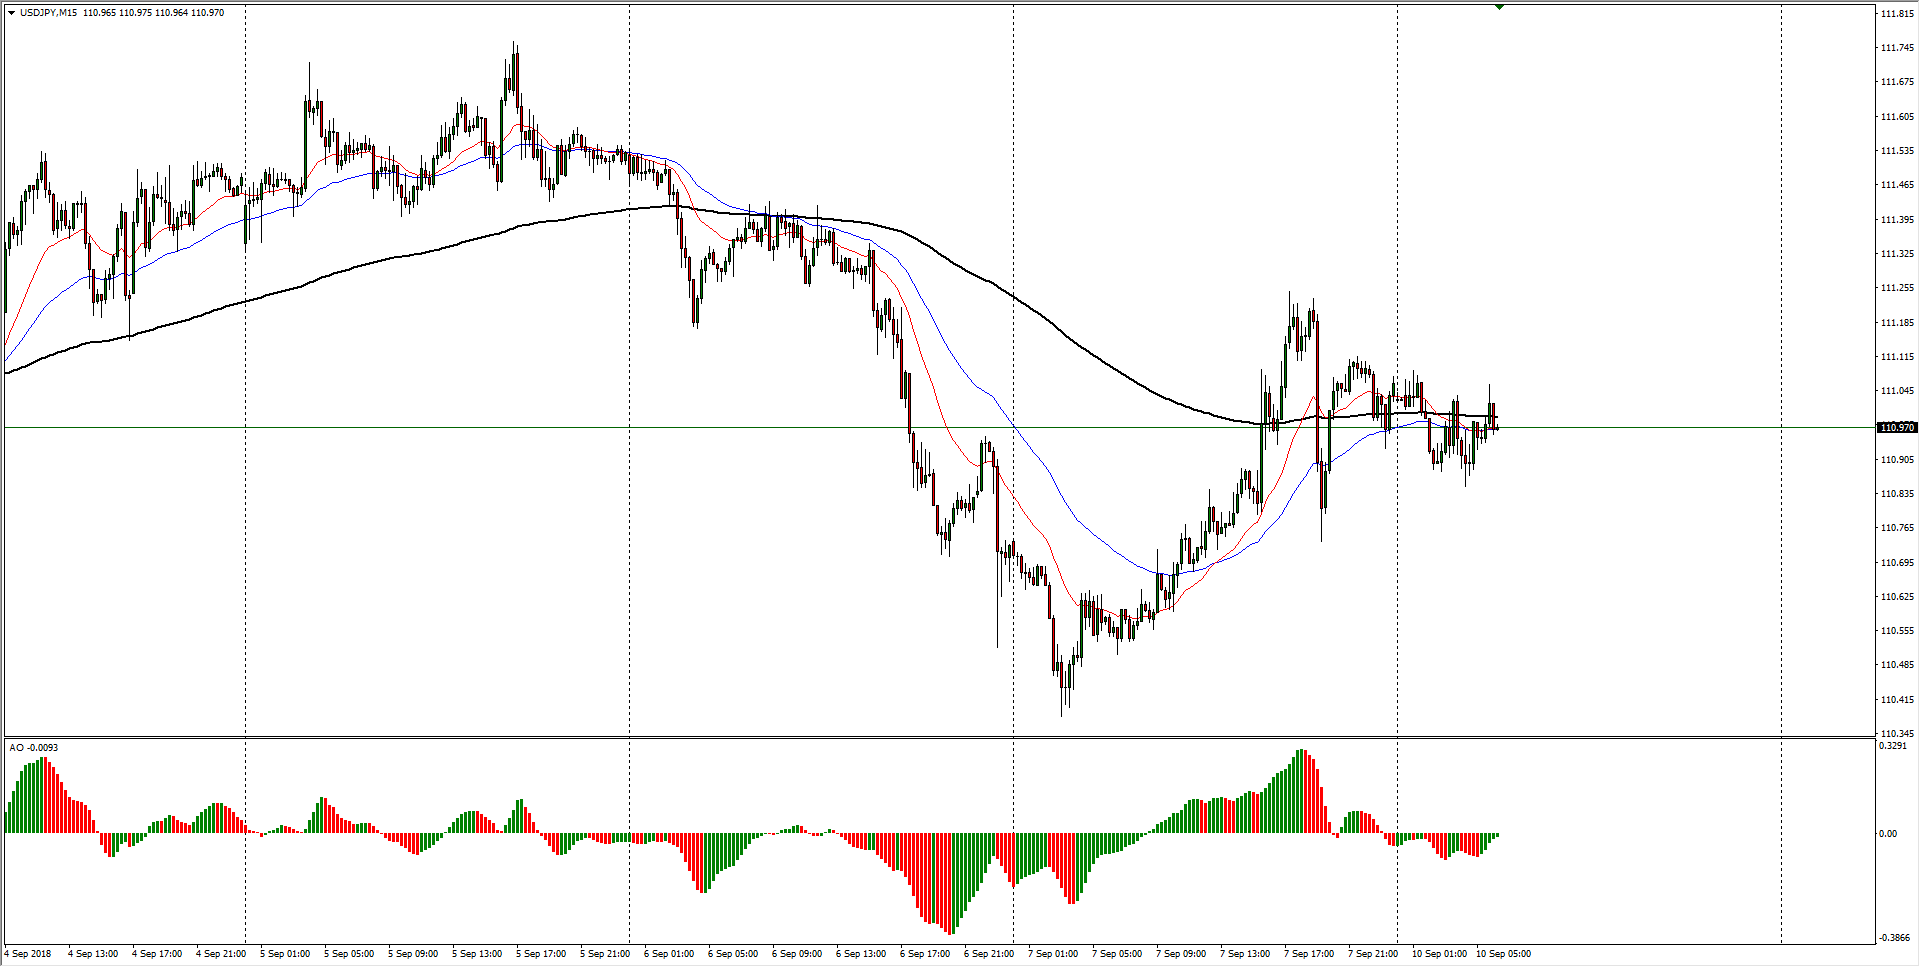
| Spot rate: | 110.97 |
| Relative change: | -0.04% |
| High: | 111.08 |
| Low: | 110.85 |
| Trend: | Sideways to bearish |
| Support 1: | 110.85 (current day low) |
| Support 2: | 110.38 (previous week low) |
| Support 3: | 110.00 (major technical level) |
| Resistance 1: | 111.11 (200-hour EMA) |
| Resistance 2: | 111.24 (Friday swing high) |
| Resistance 3: | 111.75 (previous week high) |
