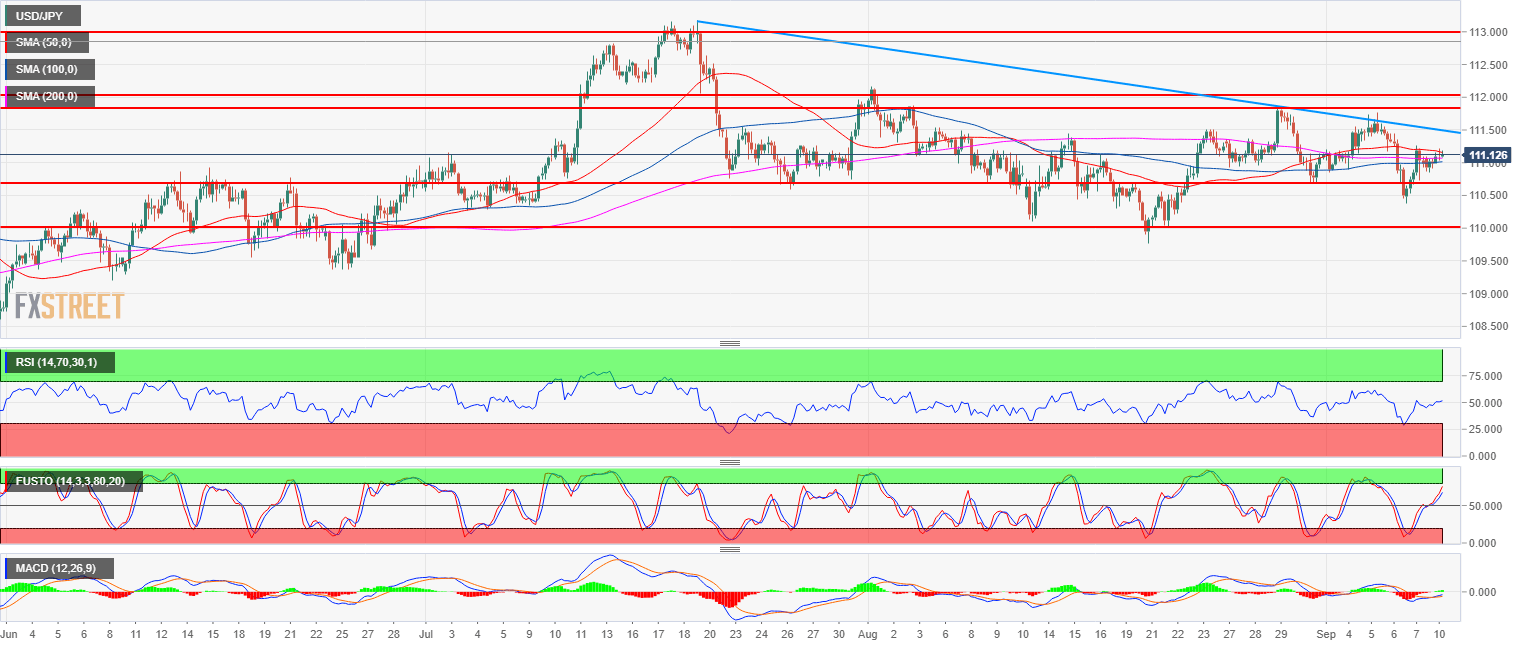
- USD/JPY main bull trend is on hold since mid-July as the market is trading in a range.
- The 50, 100 and 200-period simple moving averages are flat suggesting a lack of directional momentum.
- In the short-term bulls might try to trade back up to near 111.84 (August 29 swing high) near the top of the range. But until there is a clear bull breakout above 112.00-112.15 zone USD/JPY is destined to remain range bound.
Spot rate: 111.12
Relative change: 0.12%
High: 111.21
Low: 110.85
Main trend: Bullish
Short-term trend: Neutral
Resistance 1: 111.45 August 8 high
Resistance 2: 111.54 August 6, high
Resistance 3: 111.84 August 29 swing high
Resistance 4: 112.00-112.15 zone, figure and August 1, swing high
Resistance 5: 112.40 supply level
Resistance 6: 113.18, 2018 high
Support 1: 111.00 figure
Support 2: 110.75, July 23 swing low
Support 3: 110.00 figure
Support 4: 109.37 June 25 low
