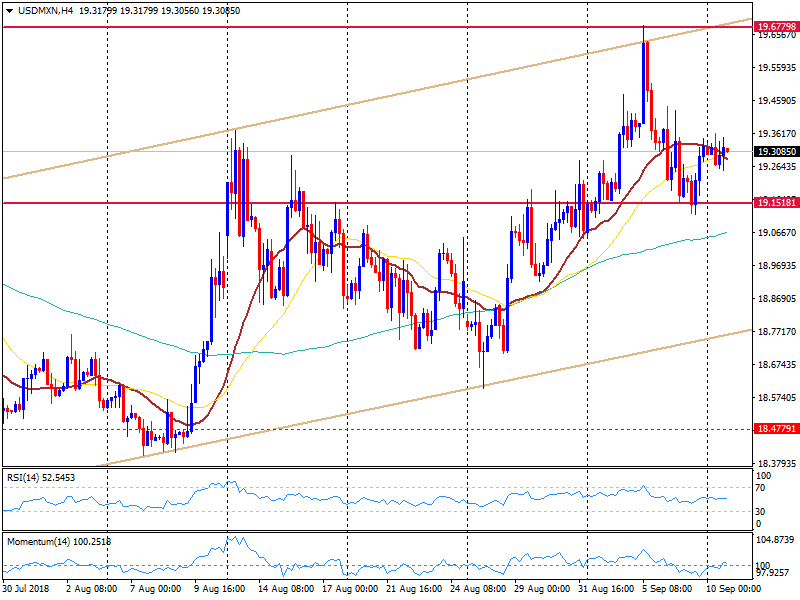
- The pair stabilized after making a run last week to 19.67 amid emergent market jitter. The move higher was followed by a correction to 19.15.
- Currently is hovering around 19.30, with the bullish bias intact. A slide below 18.80 would change the bias signaling a potential peak.
- Above 19.40, the US dollar is likely to gain momentum for a test of the 19.65/70 barrier while on the flip side support levels are seen at 19.10 and 18.90.
Spot: 19.30
Daily high: 19.35
Daily low: 19.24
Support Levels
S1: 19.25
S2: 19.10
S3: 18.90
Resistance Levels
R1: 19.40
R2: 19.67
R3: 19.90
