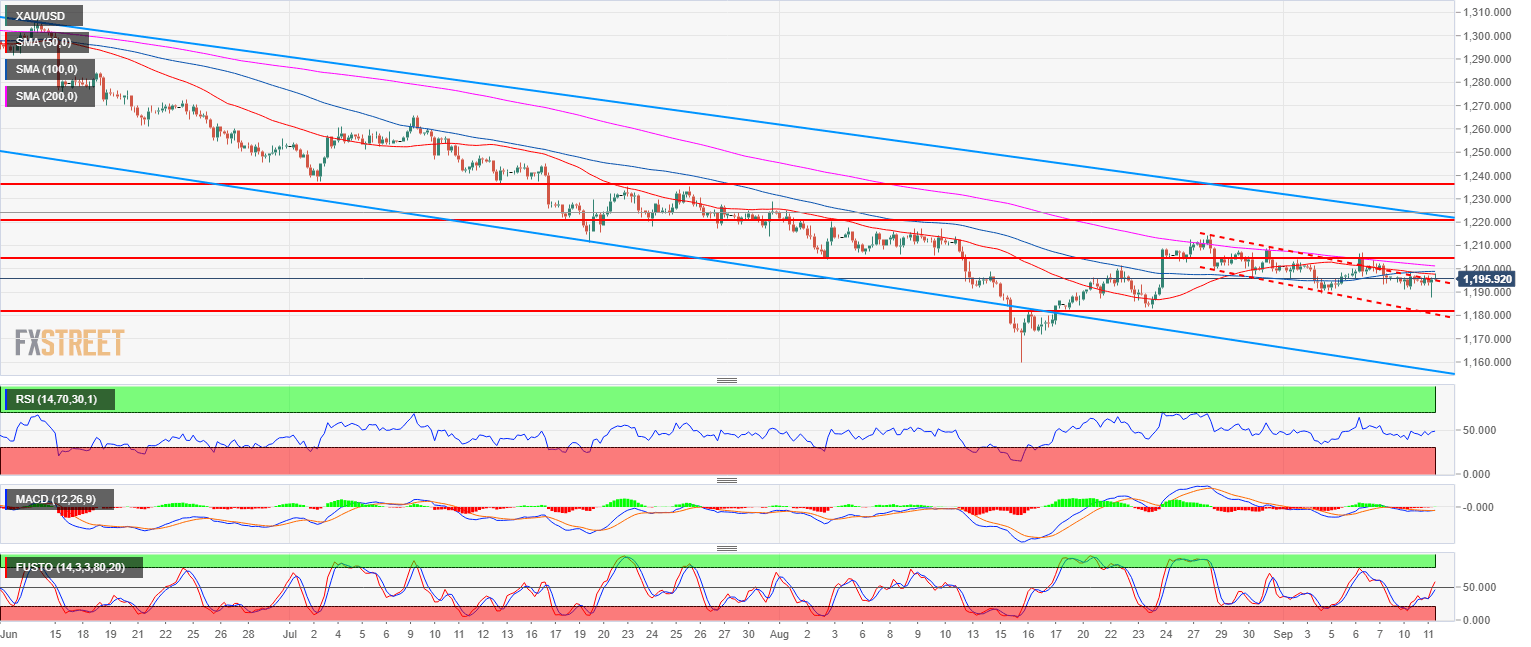
- Gold bear trend has been on hold in the last weeks of trading after the market found a bottom at $1,172.82 a troy ounce.
- Gold is consolidating in a bull flag as bulls want to break above 1,204.10 (key level) in order to drive the market to 1,225.90 July 17 low. However, bulls have a lot of work to do as they need to overcome the 50, 100 and 200-period simple moving averages.
- A bear breakout below 1,182.90 (August 24 low) would invalidate the bullish scenario and open the gates to a potential retest of the 2018 low.
Spot rate: 1,195.40
Relative change: -0.02%
High: 1,198.70
Low: 1,191.14
Trend: Bearish
Short-term trend: Bullish above 1,182.90
Resistance 1: 1,204.10, August 3 swing low (key level)
Resistance 2: 1,211.17 July 19 low
Resistance 3: 1,213.70 July 31 low
Resistance 4: 1,217.89-1,220.90 zone, August 6 high and July 18 low
Resistance 5: 1,225.90 July 17 low
Support 1: 1,194.30 March 10, 2017 low
Support 2: 1,189.49 September 4 low
Support 3: 1,172.82 current 2018 low
Support 4: 1,145.20 March, 1 2017 low
