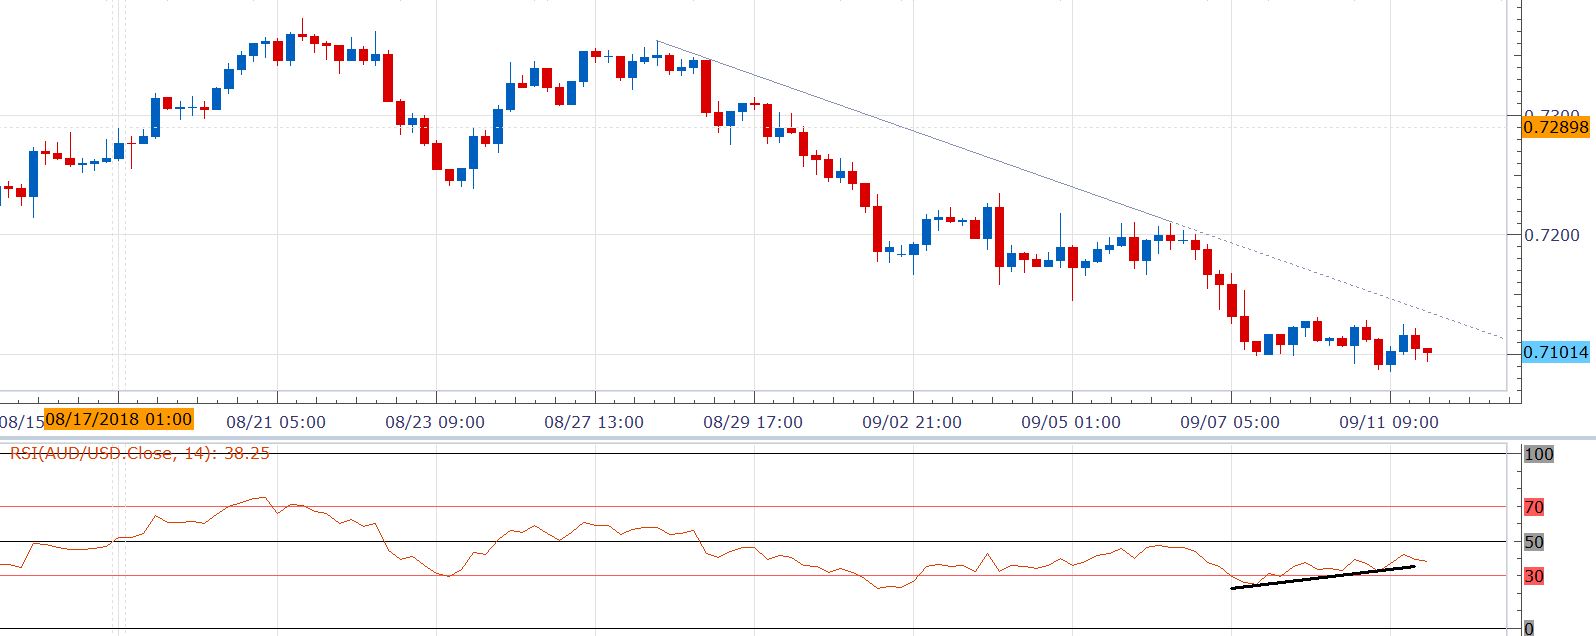
- The relative strength index (RSI) on the 4-hour chart has diverged in the AUD-positive manner, signaling the bearish momentum has weakened.
- However, only a convincing move above the trendline sloping downwards the Aug. 28 high would confirm a short-term bullish reversal and could yield a rally to 0.202 (Aug. 15 low).
- The primary trend would remain bearish as long as the 5-week and 10-week moving averages (MAs) are trending south.
4-hour Chart
Spot Rate: 0.71
Daily High: 0.7123
Daily Low: 0.7093
Trend: Teasing a bull move
R1: 0.7123 (5-day moving average + trendline resistance)
R2: 0.7145 (Sep. 5 low)
R3: 0.7166 (10-day moving average)
Support
S1: 0.71 (psychological support)
S2: 0.7085 (previous day’s low)
S3: 0.7066 (pivot S2)
