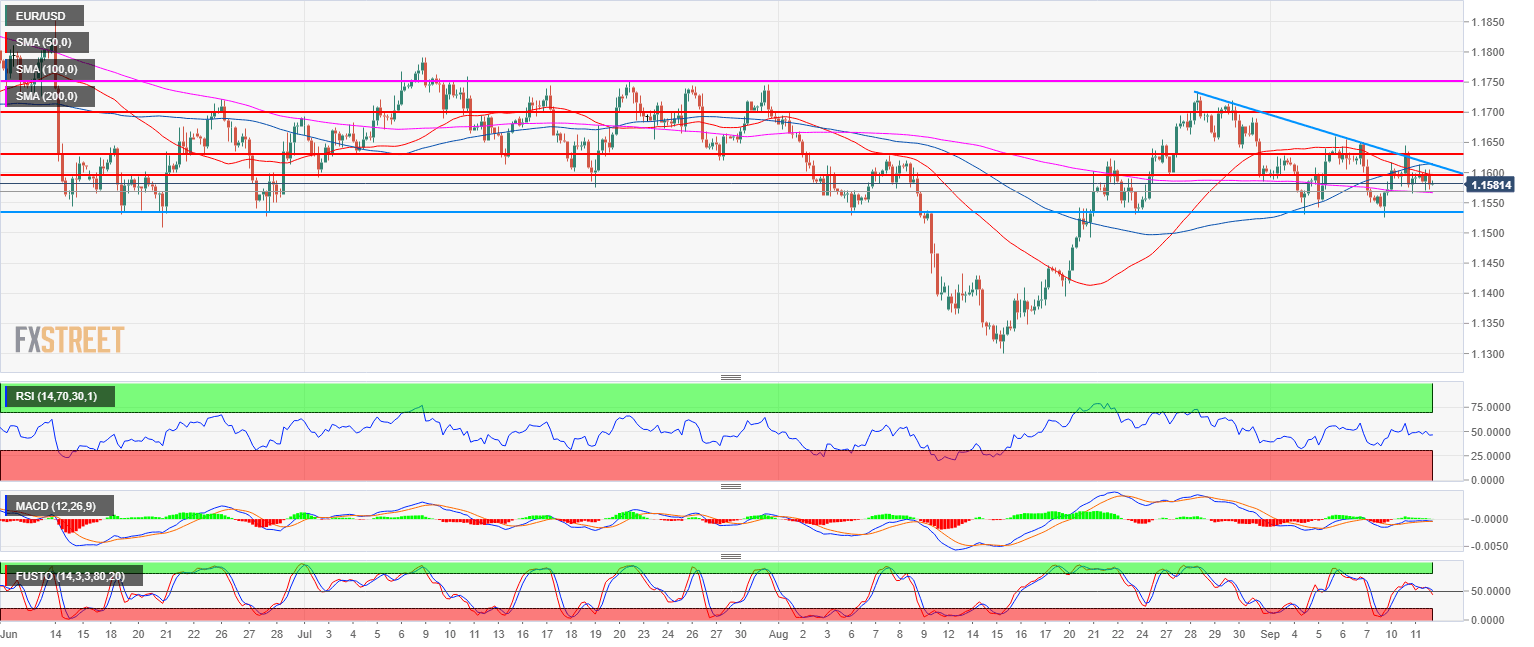
- EUR/USD main bear trend has been halted in mid-August.
- EUR/USD is currently consolidating the August rally in a triangle compression pattern (blue lines) with 1.1530 as key support for bulls. The 1.1600 level has been tough to breakout above since the start of the week. EUR/USD is also finding some decent support at the 200-period simple moving average (SMA) on the 4-hour time frame while the 100 SMA is trading above the 200 SMA which is considered a rather bullish clue.
- However, EUR/USD is trapped in a tight trading range between 1.1530 and 1.1600 and a strong directional breakout is needed above/below those levels in order to establish a clearer bias.
Spot rate: 1.1581
Relative change: -0.20%
High: 1.1609
Low: 1.1569
Main trend: Bearish
Short-term trend: Bullish above 1.1530
Resistance 1: 1.1600 figure
Resistance 2: 1.1630 August 8 high key level
Resistance 3: 1.1654 August 27 high
Resistance 4: 1.1700 figure
Resistance 5: 1.1750 key resistance (July)
Support 1: 1.1572 July 19 low
Support 2: 1.1542 supply/demand level
Support 3: 1.1530 August 23 swing low
Support 4: 1.1508 June 8 low
