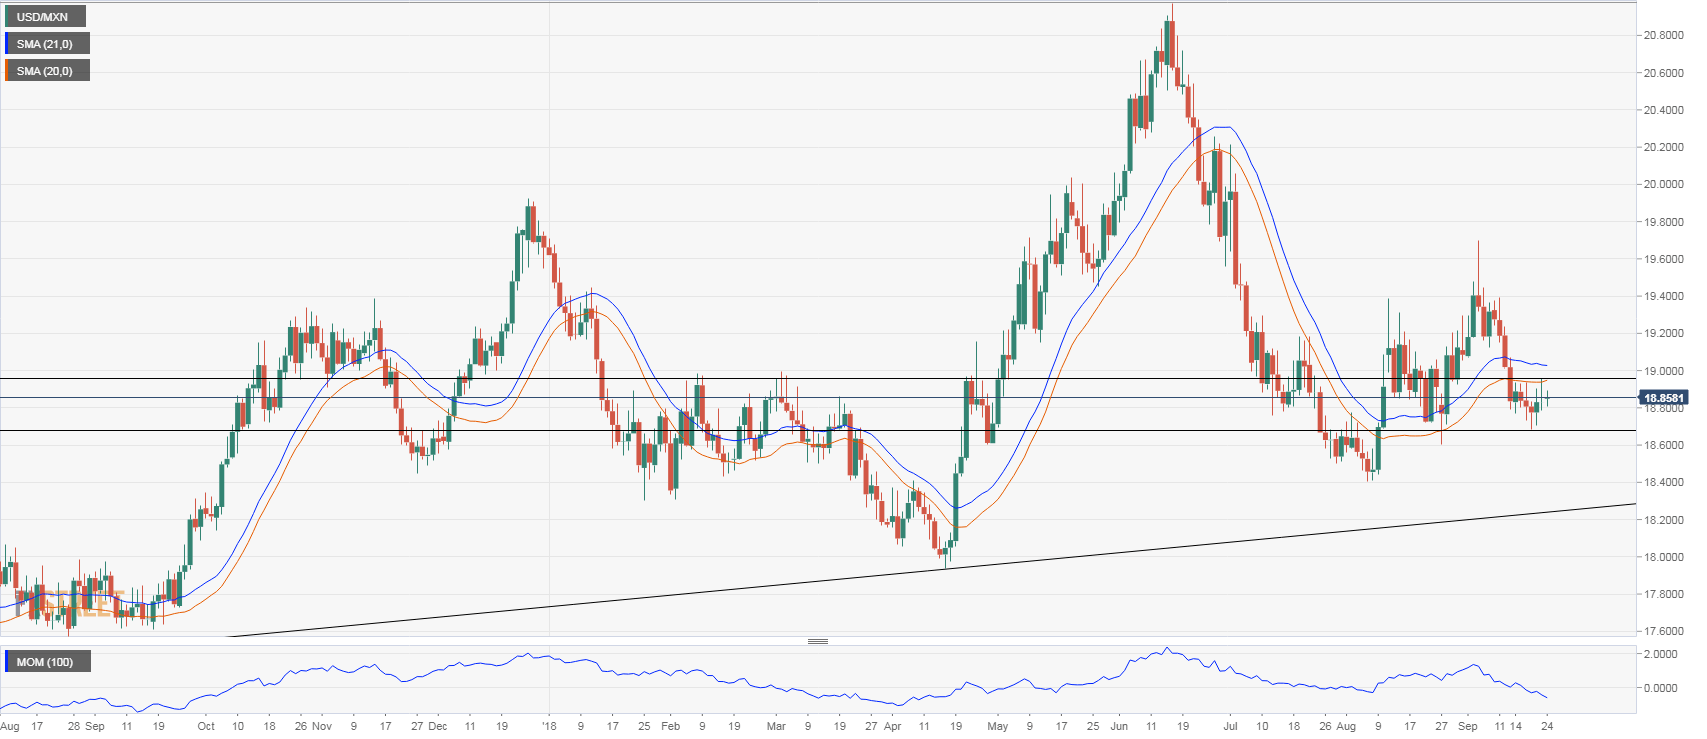
- The pair remained steady during the last sessions despite emerging markets rally. Mexican peso continues with a consolidation phase against US dollar, holding a mild bullish bias.
- USD/MXN continues to move sideways, near the 18.80 after the slide from 19.67 found support at the 18.70 area. The key resistance is seen around 18.90/95, the 20-day moving average. A daily close above would clear the way for a recovery above 19.00.
- On the flip side, the key short-term support continues to be the 18.70 zone: a break lower could open the doors for a slide to the 18.45/50 barrier.
USD/MXN Daily Chart
Spot: 18.85
Daily high: 18.87
Daily low: 18.80
Support Levels
S1: 18.80
S2: 18.70
S3: 18.50
Resistance Levels
R1: 18.95
R2: 19.15
R3: 19.30

