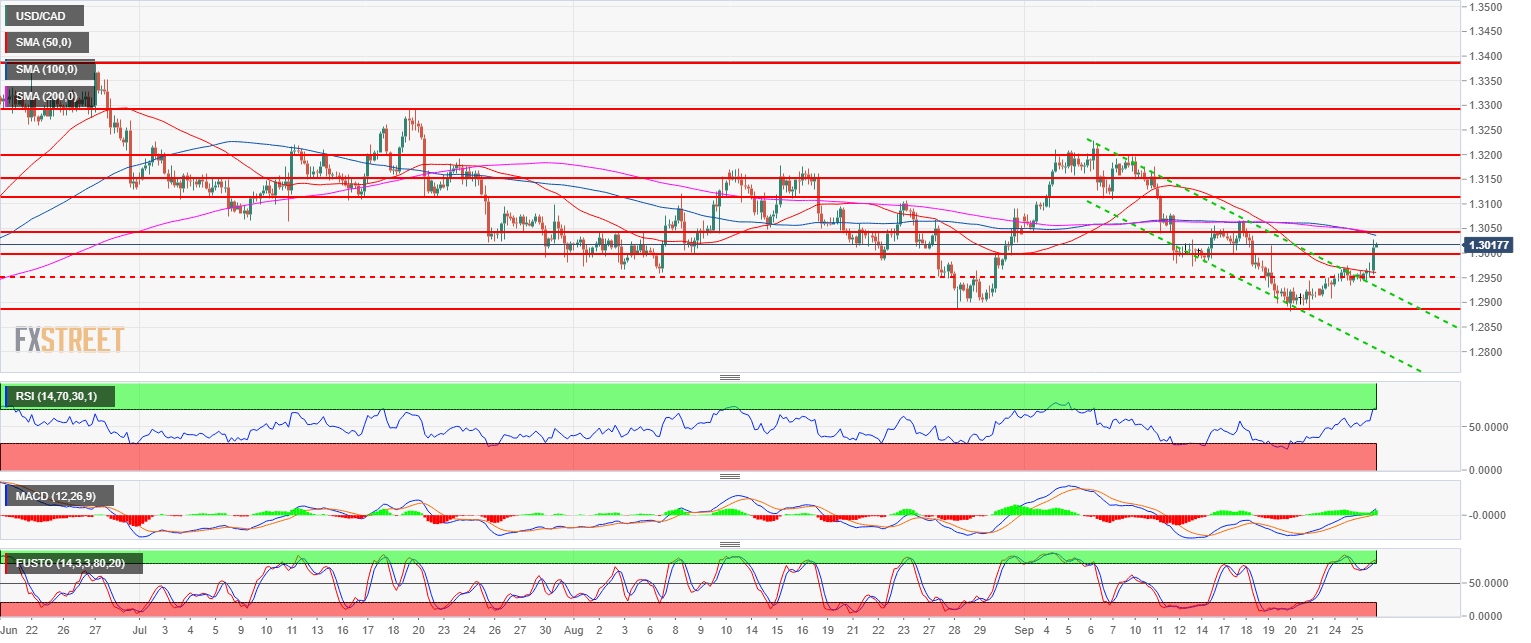
- USD/CAD created a double bottom with the August lows, giving bulls hopes to revive the main bull trend.
- USD/CAD broke above the 50-period simple moving average and is now close to testing the 100 and 200-period simple moving average near the 1.3050 level. The RSI, MACD and Stochastics indicators are rising suggesting bullish momentum.
- After reaching 1.3000 target, bulls objective is to now reach 1.3048 August 14 low and 1.3108 (September 7 low). However deep pullbacks down are to be expected near 1.2959 (August 7 low).
USD/CAD 4-hour chart
Spot rate: 1.3020
Relative change: 0.50%
High: 1.3027
Low: 1.2941
Main trend: Bullish
Resistance 1: 1.3048 August 14 low
Resistance 2: 1.3108, September 7 low
Resistance 3: 13200 figure
Support 1: 1.3000 figure
Support 2: 1.2959 August 7 low
Support 3: 1.2885 August 28 swing low
Support 3: 1.2855-65 June 6 low – 200-day SMA
Support 4: 1.2800 figure
