Home GBP/USD Technical Analysis: Bull flag consolidation is not over – More ranges ahead below 1.3100 level
FXStreet News

GBP/USD Technical Analysis: Bull flag consolidation is not over – More ranges ahead below 1.3100 level

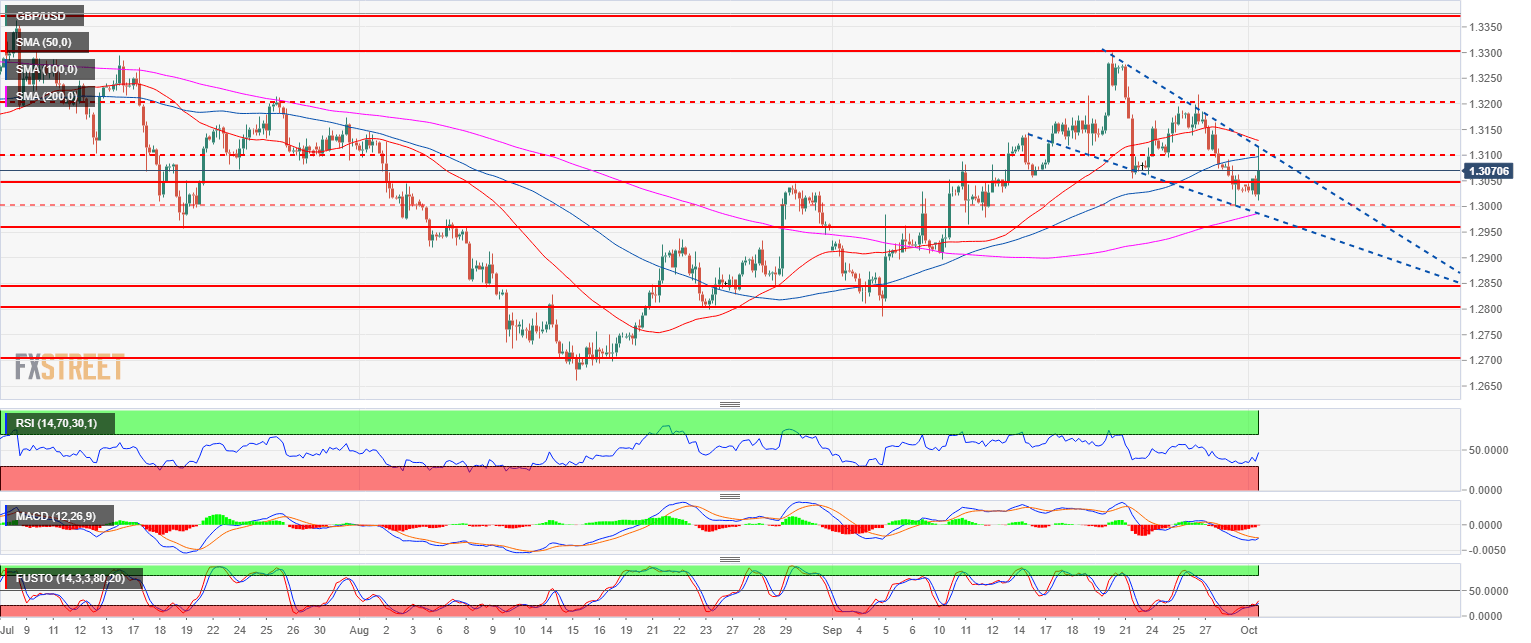
  • GBP/USD is consolidating the recent gains in a bull flag.  
  • GBP/USD is trading below its 50 and 100-period simple moving averages (SMA) while it is holding above the 200 SMA and the 1.3000 figure. The RSI, MACD and Stochastics indicators are starting to rise.
  • However, the market might need to consolidate some more with maybe a test or the 200 SMA and the 1.3000 figure before big bulls come back and lift the market once more.    

GBP/USD 4-hour chart

Spot rate:                         1.3072
Relative change:               0.33%      
High:                                1.3116
Low:                                 1.3012

Main trend:                      Bullish
Short-term trend:              Neutral

Resistance 1:                  1.3100 figure
Resistance 2:                  1.3144 key level
Resistance 3:                  1.3200 figure (key support/resistance)
Resistance 4:                  1.3300 figure
Resistance 5:                  1.3363 July high
Resistance 6:                  1.3472 June 7 high

Support 1:                      1.3050 August 30 swing high, key level
Support 2:                      1.3000 figure    
Support 3:                      1.2957 July 19 swing low
Support 4:                      1.2900 figure  

FX Street

FX Street

FXStreet is the leading independent portal dedicated to the Foreign Exchange (Forex) market. It was launched in 2000 and the portal has always been proud of their unyielding commitment to provide objective and unbiased information, to enable their users to take better and more confident decisions.