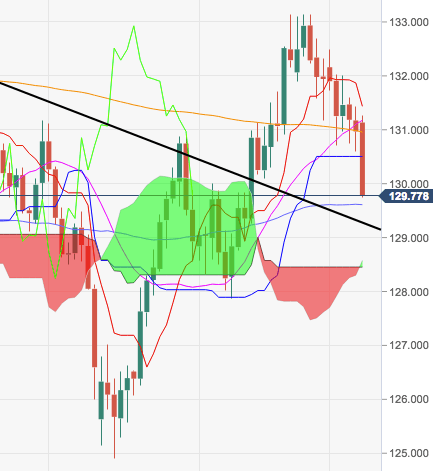
- Renewed and strong selling pressure around the single currency plus the risk-off environment are dragging EUR/JPY to fresh multi-day lows and a potential test of the 55-day SMA in the 129.60 region.
- A breakdown of this area should pave the way for a test of the (now) support line off 2018 tops, today at 129.27.
- Further south the cross should mee September’s low at 127.86 ahead of August’s low at 124.90.
EUR/JPY daily chart
EUR/JPY
Overview:
Last Price: 129.81
Daily change: -1.2e+2 pips
Daily change: -0.886%
Daily Open: 130.97
Trends:
Daily SMA20: 131.25
Daily SMA50: 129.59
Daily SMA100: 129.37
Daily SMA200: 131.01
Levels:
Daily High: 131.44
Daily Low: 130.6
Weekly High: 132.49
Weekly Low: 130.6
Monthly High: 133.15
Monthly Low: 127.87
Daily Fibonacci 38.2%: 130.92
Daily Fibonacci 61.8%: 131.12
Daily Pivot Point S1: 130.57
Daily Pivot Point S2: 130.17
Daily Pivot Point S3: 129.74
Daily Pivot Point R1: 131.4
Daily Pivot Point R2: 131.84
Daily Pivot Point R3: 132.24
