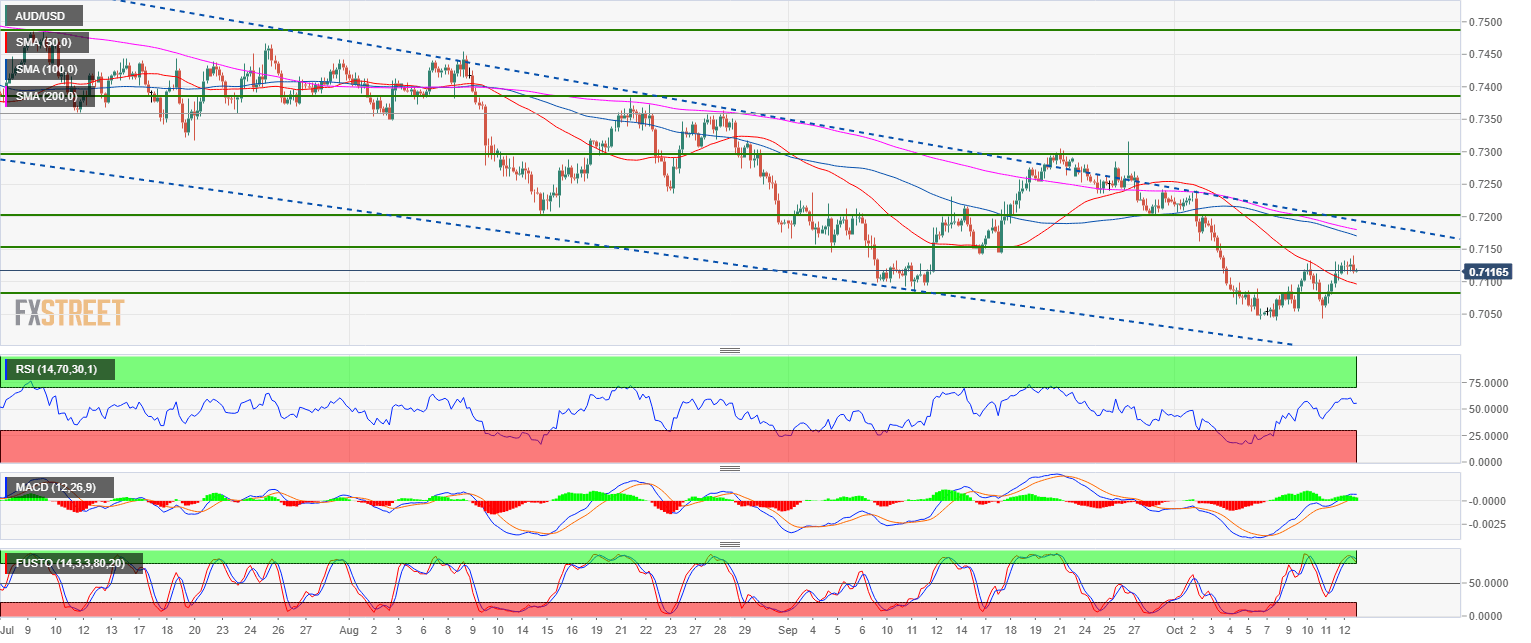
- AUD/USD is in a bear trend as it is trading below its 100 and 200-period simple moving average on the 4-hour chart.
- AUD/USD found a bottom at 0.7041 as the bulls created a lower low with the September low. The RSI and the Stochastic indicators are trading above the 50 line and the MACD is bullish. A short-term bullish bias is maintained while the current October low at 0.7041 underpins on a daily chart closing basis.
- Upside targets can be located near 0.7144 (September 5 low) and 0.7200 figure.
Spot rate: 0.7115
Relative change: -0.1 %
High: 0.7141
Low: 0.7111
Main trend: Bearish
Short-term trend: Bullish above 0.7041
Resistance 1: 0.7144 September 5 low
Resistance 2: 0.7200 figure August 15 low
Resistance 3: 0.7300 figure
Support 1: 0.7100 figure
Support 2: 0.7085, September 11 low
Support 3: 0.7041 October low
Support 4: 0.7000 figure
Support 5: 0.6830 January 15, 2016 low
