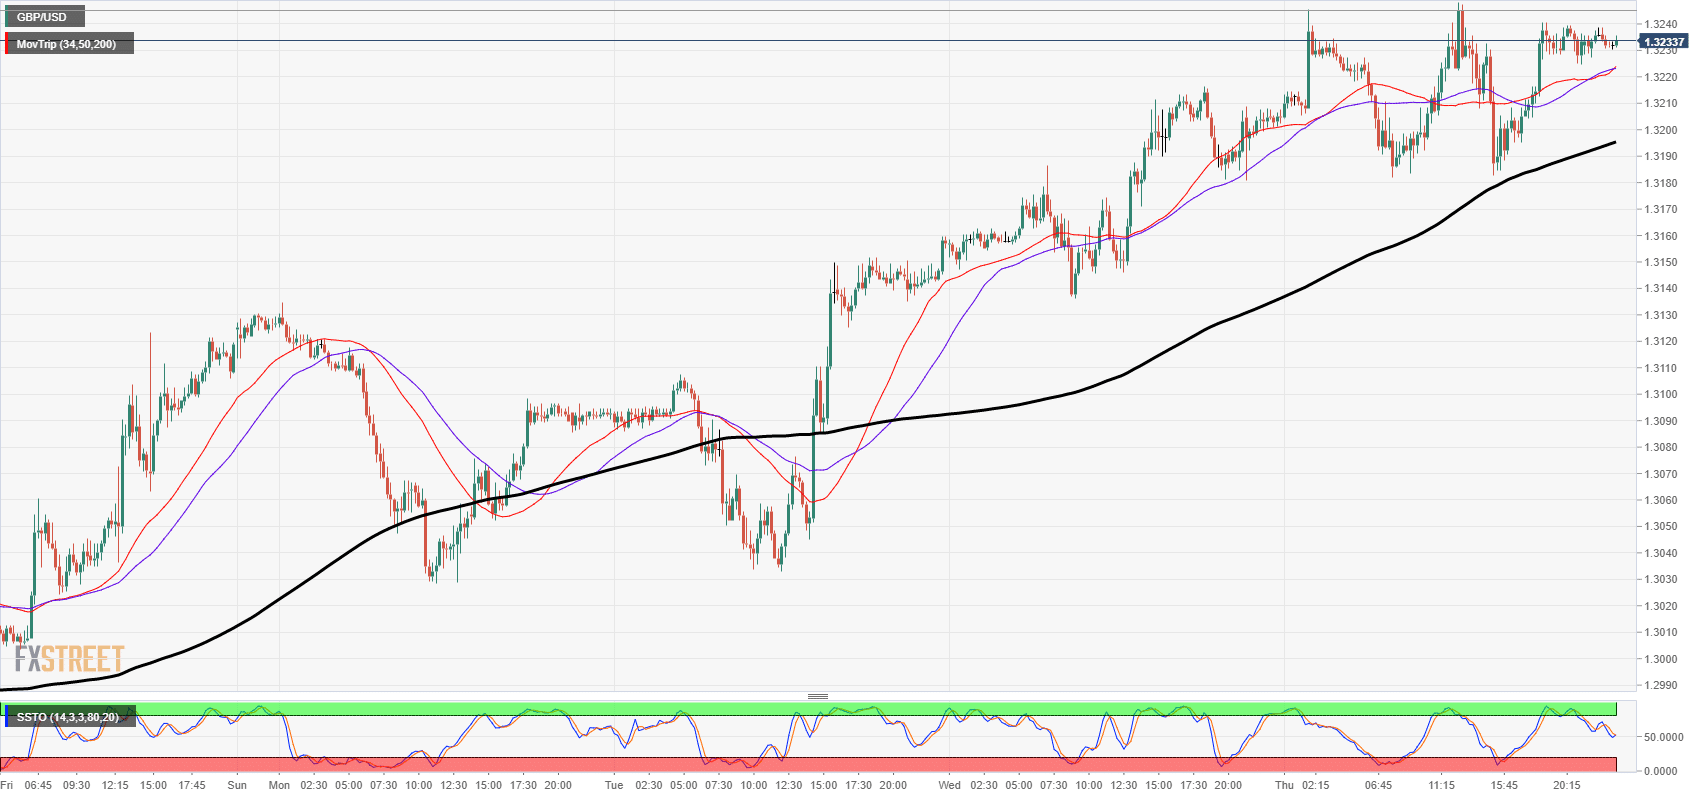
- The Sterling has coiled into a tight consolidation range through Friday’s early Asian action as the pair winds into the end-week’s European markets.
- The week’s swing highs are representing significant resistance for the pair, despite the GBP’s overall impressive performance this week, fueled by Brexit hopes bolstering the Cable.
- The Cable is being supported by a rising 200-hour moving average, with the 50-hour EMA keeping the pair on the upside from the 1.3200 major level.
GBP/USD
Overview:
Last Price: 1.323
Daily change: -4.0 pips
Daily change: -0.0302%
Daily Open: 1.3234
Trends:
Daily SMA20: 1.311
Daily SMA50: 1.2979
Daily SMA100: 1.3102
Daily SMA200: 1.3492
Levels:
Daily High: 1.3248
Daily Low: 1.3181
Weekly High: 1.3123
Weekly Low: 1.2922
Monthly High: 1.33
Monthly Low: 1.2897
Daily Fibonacci 38.2%: 1.3223
Daily Fibonacci 61.8%: 1.3207
Daily Pivot Point S1: 1.3194
Daily Pivot Point S2: 1.3154
Daily Pivot Point S3: 1.3126
Daily Pivot Point R1: 1.3261
Daily Pivot Point R2: 1.3288
Daily Pivot Point R3: 1.3329
