- EUR/USD is in a bull leg as it found support at the 1.1530 key level.
- EUR/USD is trading above its 50-period simple moving average as the market is trying to break above the 1.1600 figure. The RSI and Stochastic indicators are trading above the 50 line suggesting that the path of least resistance is to the upside.
- A break above 1.1600-1.1630 should open the gate to 1.1700 figure. However a bear breakout below 1.1530 should invalidate the bullish bias.
EUR/USD 4-hour chart
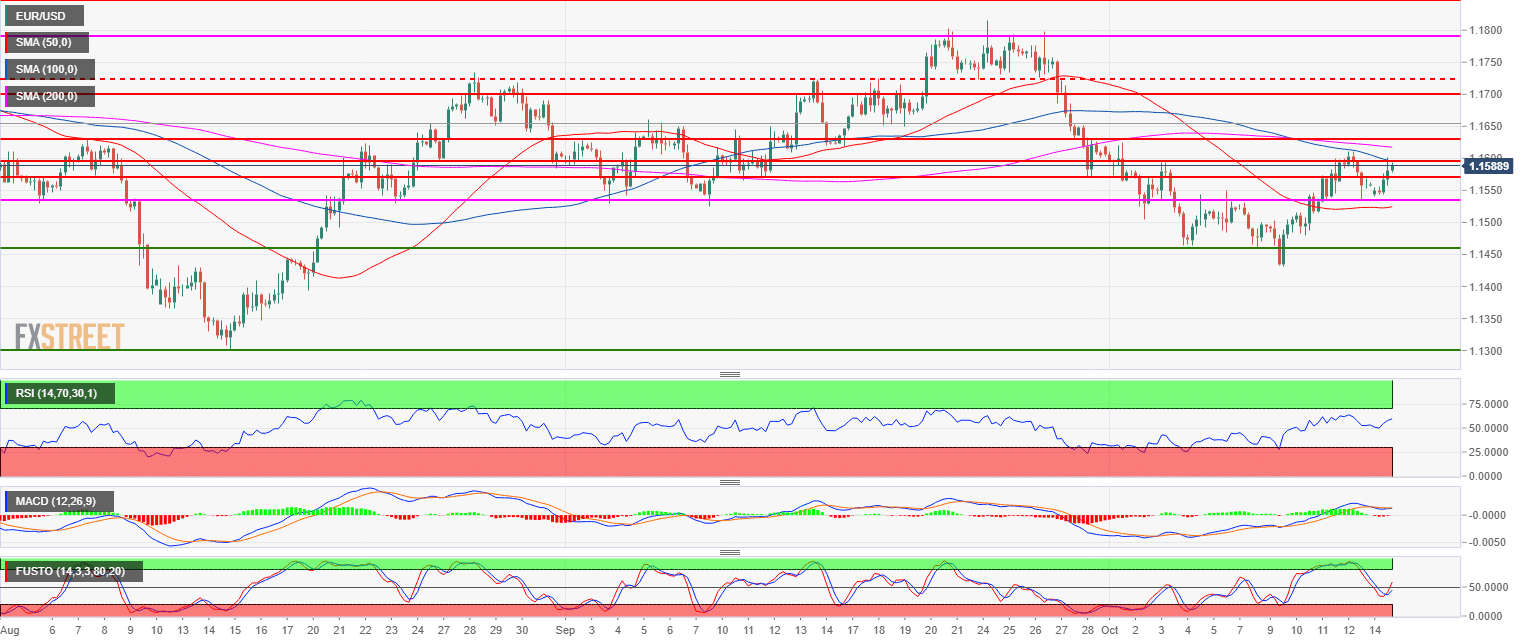
Spot rate: 1.1591
Relative change: 0.26%
High: 1.1601
Low: 1.1540
Main trend: Bearish
Short-term trend: Bullish
Resistance 1: 1.1600 figure
Resistance 2: 1.1630 August 8 high key level
Resistance 3: 1.1654 August 27 high
Support 1: 1.1569 Sept. 28 low
Support 2: 1.1530 August 23 swing low (key level)
Support 3: 1.1500 figure and October 2 swing low
Support 4: 1.1463 October 4 low
Support 5: 1.1430 October 9 low
