- USD/CAD is trading sideways between the 100 and 200-period simple moving average on the 4-hour chart.
- USD/CAD strongly broke below 1.3000 figure as the market formed a double top with the late September highs. The RSI, MACD and Stochastic indicators are encouraging for more losses ahead.
- Targets can be located near 1.2950-59 zone (multi-month key level and August 7 low) and should the zone break an extension of the downfall should at least reach 1.2924 (October 10 low).
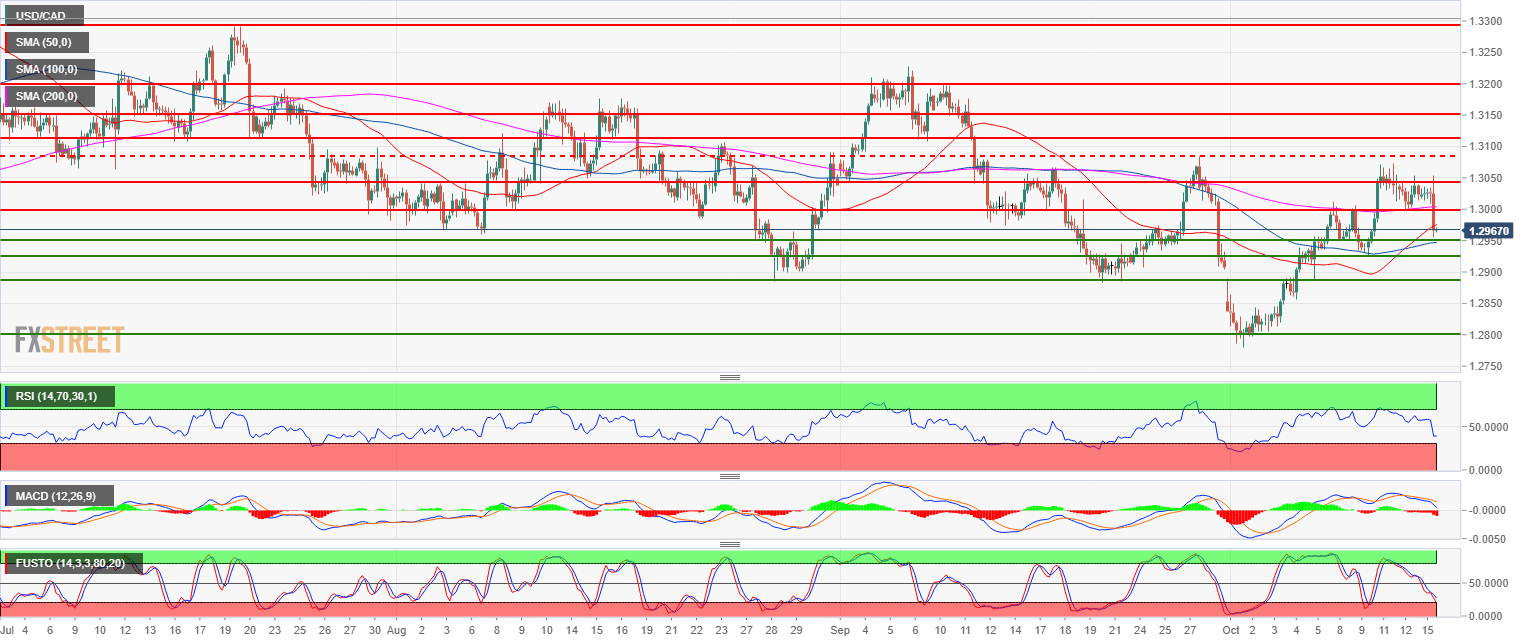
Spot rate: 1.2969
Relative change: -0.43%
High: 1.3053
Low: 1.2954
Main trend: Neutral
Resistance 1: 1.3000 figure
Resistance 1: 1.3048 August 14 low
Resistance 2: 1.3083 September 27 swing high
Resistance 3: 1.3108, September 7 low
Resistance 4: 1.3200 figure
Support 1: 1.2950-59 multi-month key level and August 7 low
Support 2: 1.2924 October 10 low
Support 3: 1.2882-1.2900 September 20 low and figure
Support 4: 1.2855-65 June 6 low – 200-day SMA
Support 5: 1.2800 figure
Support 6: 1.2727 May 11 low
