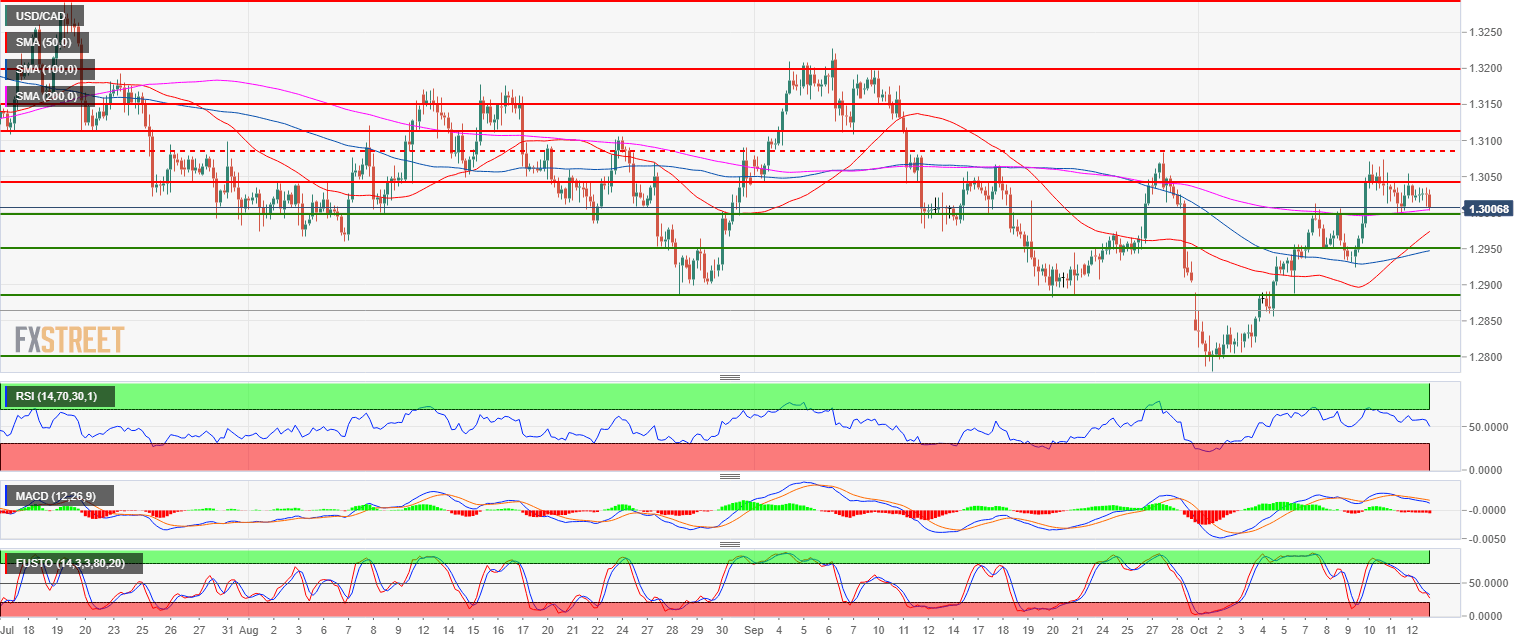
- USD/CAD is trading just above a flat 200-period simple moving average suggesting a sideways market.
- USD/CAD bears objective is to break below the 1.3000 figure. USD/CAD formed a double top with the late September highs. The RSI, MACD and Stochastic indicators are also suggesting further weakness ahead.
- Targets to the downside are seen near 1.2950-59 zone (multi-month key level and August 7 low) and 1.2882-1.2900 zone (September 20 low and figure). However a bull breakout above 1.3108 (September 7 low) should invalidate the current bearish bias.
USD/CAD 4-hour chart
Spot rate: 1.3010
Relative change: 0.1%
High: 1.3035
Low: 1.3003
Main trend: Bullish
Resistance 1: 1.3048 August 14 low
Resistance 2: 1.3083 September 27 swing high
Resistance 3: 1.3108, September 7 low
Resistance 4: 1.3200 figure
Support 1: 1.3000 figure
Support 2: 1.2950-59 multi-month key level and August 7 low
Support 3: 1.2882-1.2900 September 20 low and figure
Support 4: 1.2855-65 June 6 low – 200-day SMA
Support 5: 1.2800 figure
Support 6: 1.2727 May 11 low
