- EUR/USD is trading in a bull leg above its 50-period simple moving average on the 4-hour chart.
- EUR/USD is holding above 1.1530 for the third consecutive day. The bulls are challenging the 100 SMA as the market is trading in a tight 30 pip range below the 1.1600 figure. The RSI, MACD and Stochastic indicators are constructive for more gains. The 1.1600-1.1630 resistance might be hard to break but if it does the bull run might accelerate to 1.1700 figure.
- On the flip side, a bear breakout below 1.1530 would likely invalidate the current bullish bias.
EUR/USD 4-hour chart
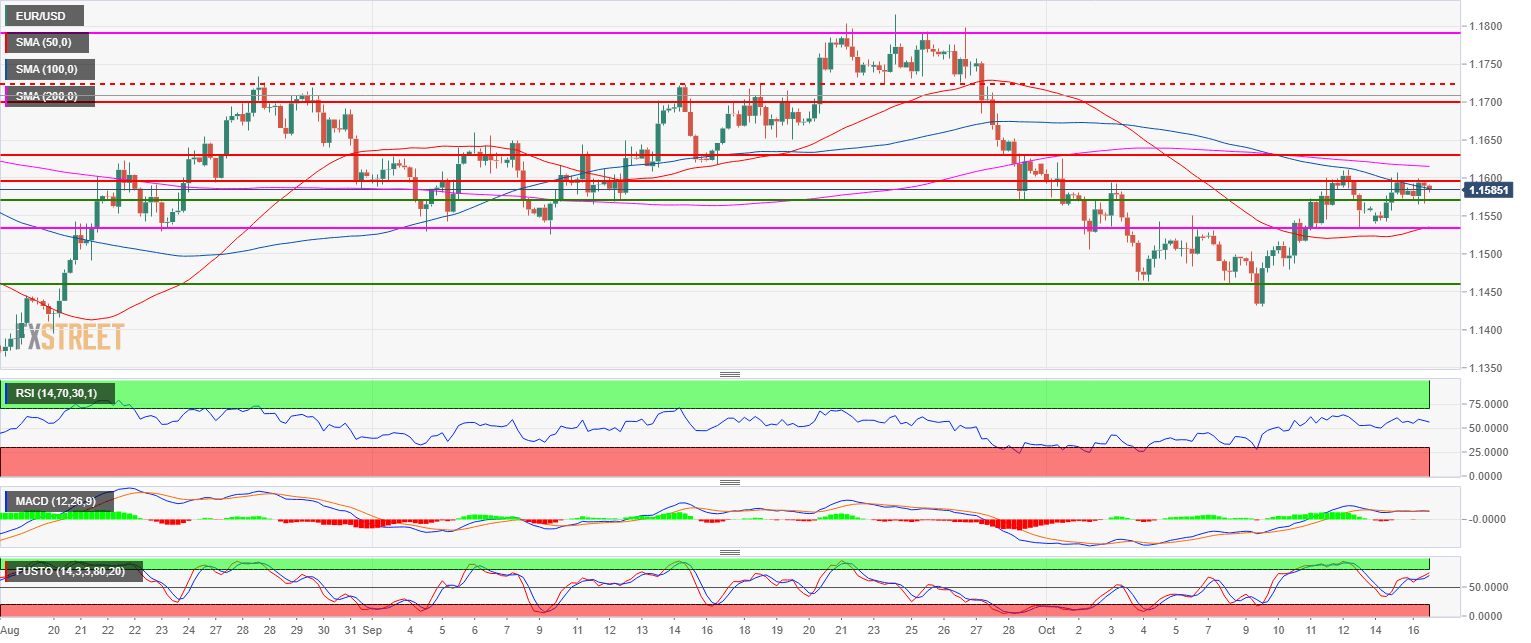
Spot rate: 1.1583
Relative change: 0.03%
High: 1.1599
Low: 1.1565
Main trend: Bearish
Short-term trend: Bullish
Resistance 1: 1.1600 figure
Resistance 2: 1.1630 August 8 high key level
Resistance 3: 1.1654 August 27 high
Support 1: 1.1569 Sept. 28 low
Support 2: 1.1530 August 23 swing low (key level)
Support 3: 1.1500 figure and October 2 swing low
Support 4: 1.1463 October 4 low
Support 5: 1.1430 October 9 low
