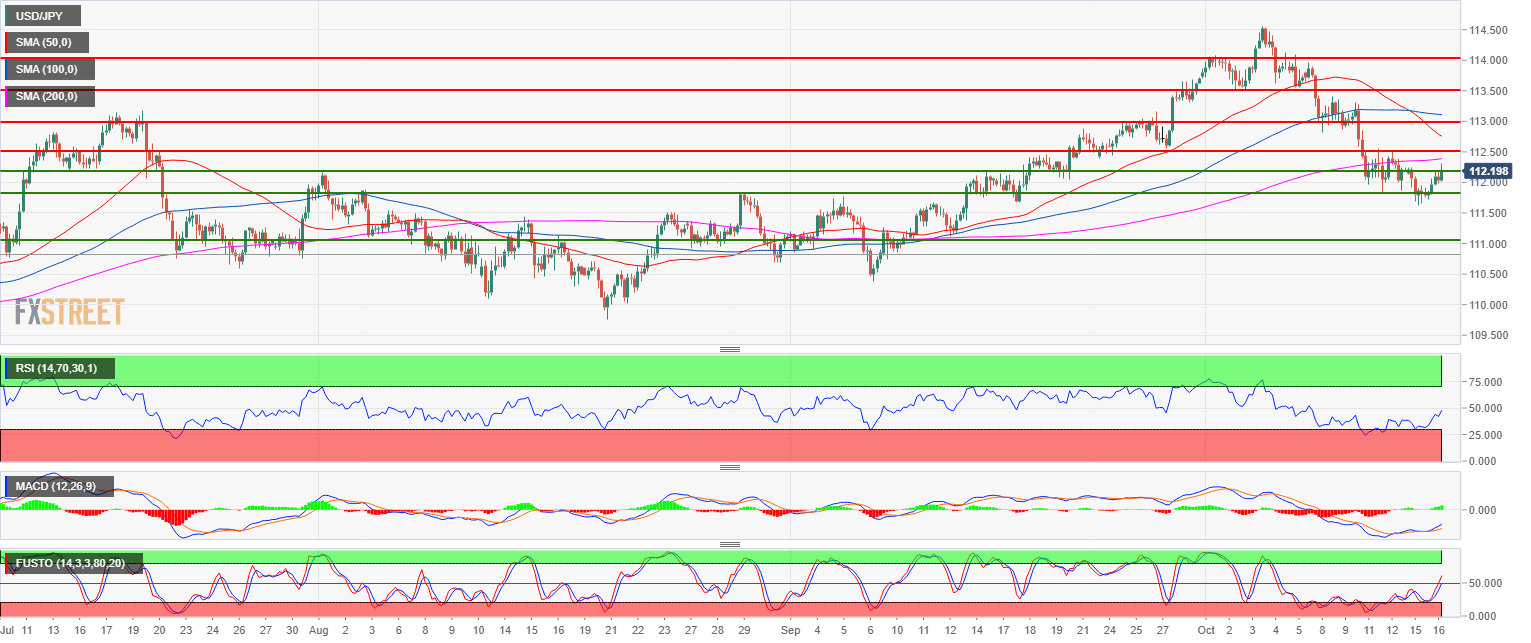
- USD/JPY is in a bullish trend and pulled back down to the 200-period simple moving average on the 4-hour chart.
- USD/JPY is stabilizing above the 112.00 level as bulls might potentially start a new bull run from there. The RSI is still is at 49 suggesting weak while the MACD and Stochastic are rising which is encouraging for bulls. Resistances can be located near 112.55 (September 27 low) and 113.00.
- However, a bear breakout below 111.84 (August 29 swing high) on a daily closing basis should invalidate the bullish bias.
USD/JPY 4-hour chart
Spot rate: 112.20
Relative change: 0.37%
High: 112.31
Low: 111.72
Main trend: Bullish
Resistance 1: 112.55 September 27 low
Resistance 2: 113.00 figure
Resistance 3: 113.55 October 2 low
Resistance 4: 113.55 October 2 low
Resistance 5: 114.00 figure
Resistance 6: 114.80 November 2017 high
Resistance 7: 115.50 March 10, 2017 high
Support 1: 112.00-112.17 zone, figure and August 1 swing high
Support 2: 111.84 August 29 swing high
Support 3: 111.00 figure
