- The GBP/JPY has been making halting progress after recovering from the week’s early slip, and buyers continue to remain to the positive side despite ongoing Brexit tensions, which could come to a head at Wednesday’s EU leadership summit in Brussels.
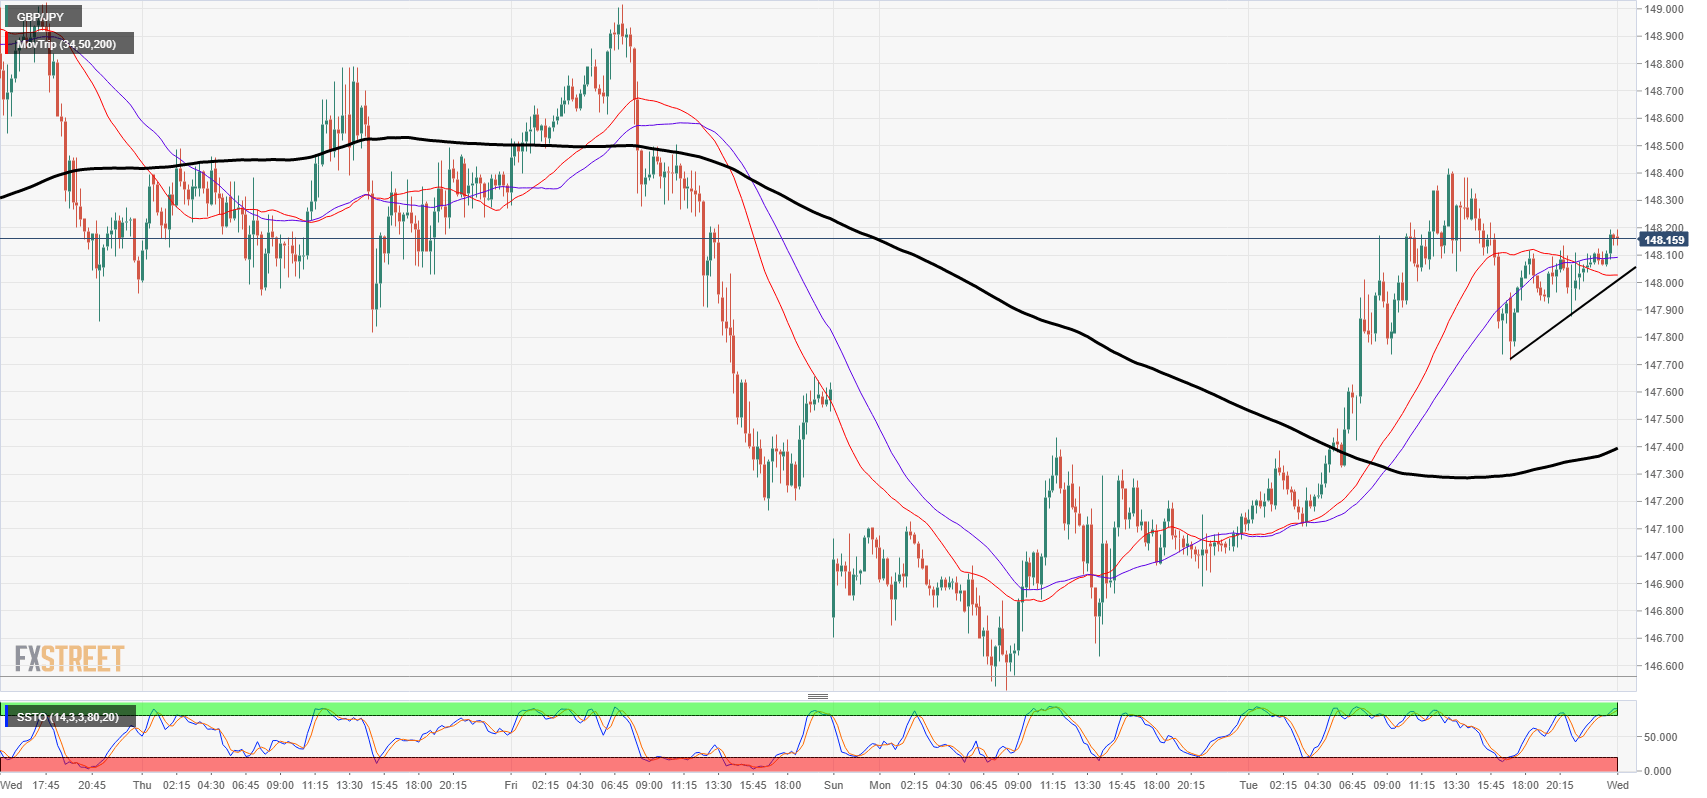
- The 50-period moving average is helping to drag the pair higher of the charts as time wears on, and the 200-period is rolling over into a bullish stance, but the Guppy could still see a retracement to the major indicator before continuing higher.
- Traders should watch for a break of rising swing lows to indicate tension on the intraday charts.
GBP/JPY Chart, 15-Minute
GBP/JPY
Overview:
Last Price: 148.16
Daily change: 18 pips
Daily change: 0.122%
Daily Open: 147.98
Trends:
Daily SMA20: 148.18
Daily SMA50: 145.35
Daily SMA100: 145.84
Daily SMA200: 148.04
Levels:
Daily High: 148.42
Daily Low: 146.89
Weekly High: 149.52
Weekly Low: 147.17
Monthly High: 149.72
Monthly Low: 146.32
Daily Fibonacci 38.2%: 147.83
Daily Fibonacci 61.8%: 147.47
Daily Pivot Point S1: 147.11
Daily Pivot Point S2: 146.24
Daily Pivot Point S3: 145.58
Daily Pivot Point R1: 148.63
Daily Pivot Point R2: 149.29
Daily Pivot Point R3: 150.16
