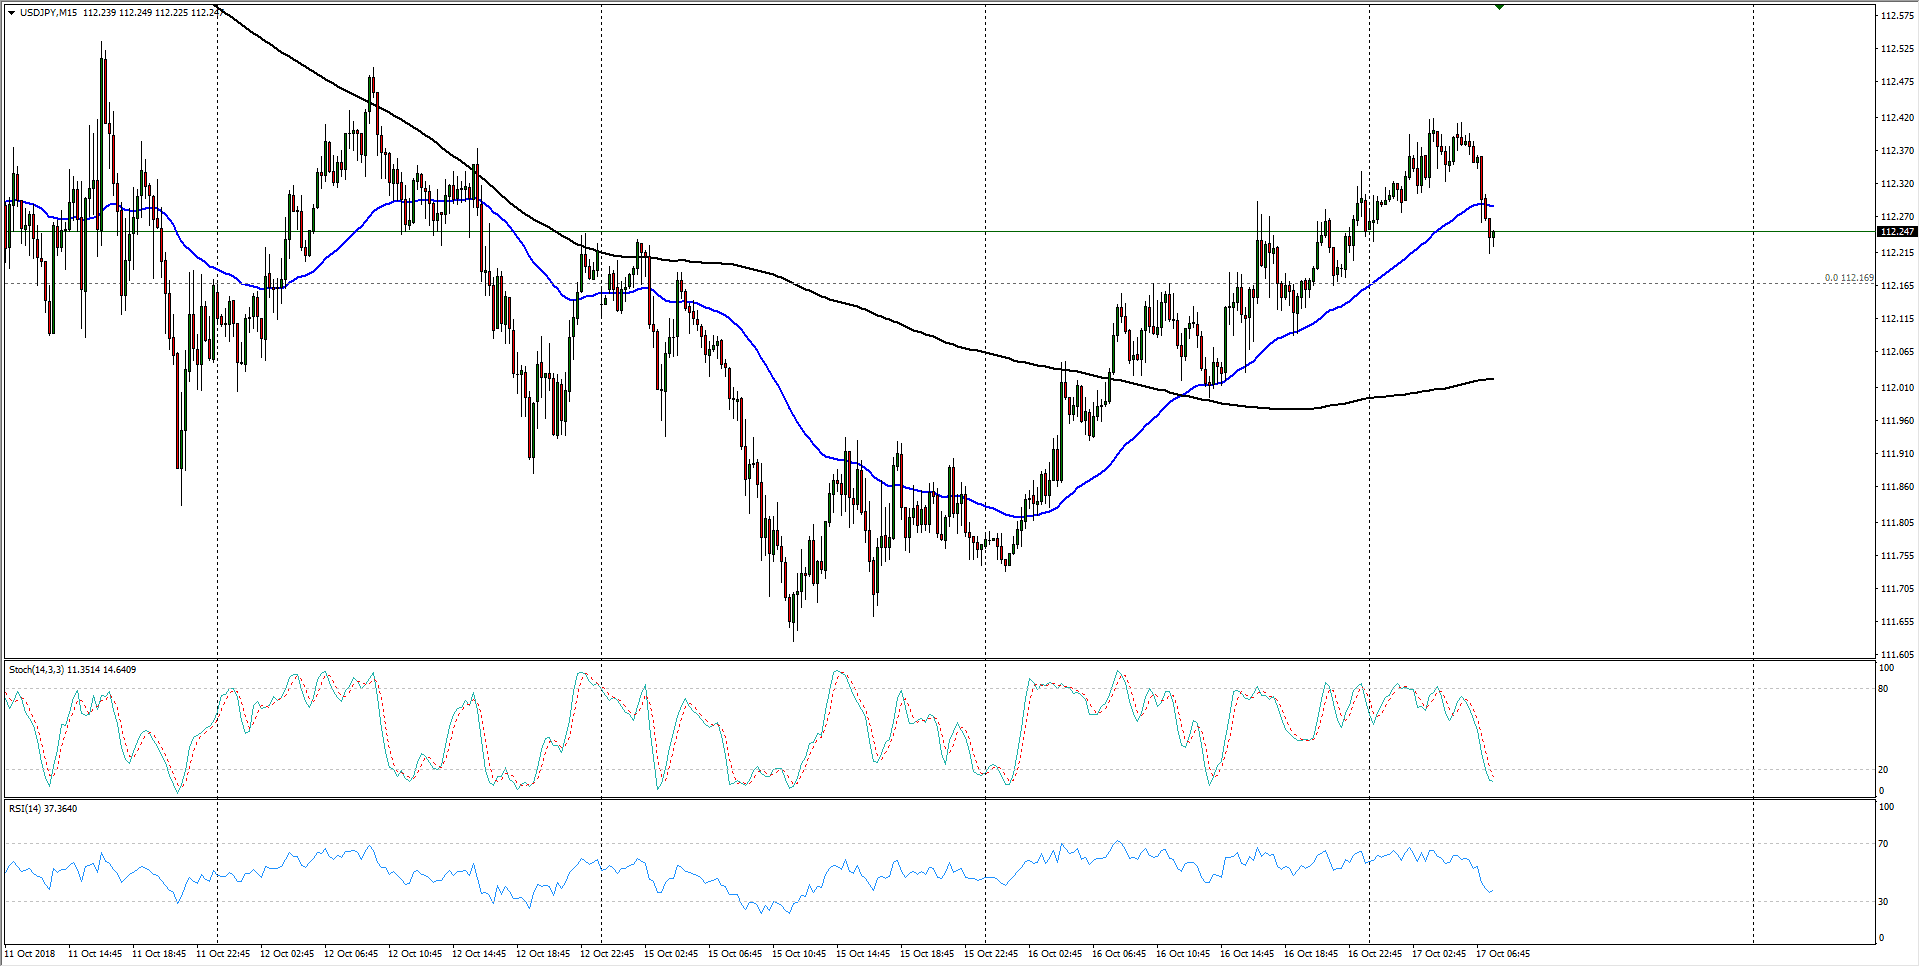
- The Dollar-Yen pairing is showing signs of breaking back down after lifting steadily through yesterday’s trading, clipping back beneath the 50-period moving average on 15-minute candlesticks.
- Swing highs from late last week are also flashing warning signs of continued selling pressure from just above 112.00, and a 200-period moving average that has gone flat, rolling into bullish could still draw the pair back lower.
- On the higher timeframes, technical indicators are rolling over into short signals from overbought territory, or near to it, adding further credence to a potential downside move in the US Dollar for Wednesday.
USD/JPY
Overview:
Last Price: 112.24
Daily change: -2.0 pips
Daily change: -0.0178%
Daily Open: 112.26
Trends:
Daily SMA20: 112.98
Daily SMA50: 111.88
Daily SMA100: 111.35
Daily SMA200: 109.83
Levels:
Daily High: 112.35
Daily Low: 111.72
Weekly High: 113.96
Weekly Low: 111.83
Monthly High: 114.56
Monthly Low: 111.66
Daily Fibonacci 38.2%: 112.11
Daily Fibonacci 61.8%: 111.96
Daily Pivot Point S1: 111.87
Daily Pivot Point S2: 111.48
Daily Pivot Point S3: 111.24
Daily Pivot Point R1: 112.5
Daily Pivot Point R2: 112.74
Daily Pivot Point R3: 113.12
