- The Guppy hasn’t given up hope yet, despite bull-slaying Brexit headlines, and the GBP/JPY is trying to recover the week’s early bullish momentum from Wednesday’s bottom at the 147.00 handle.
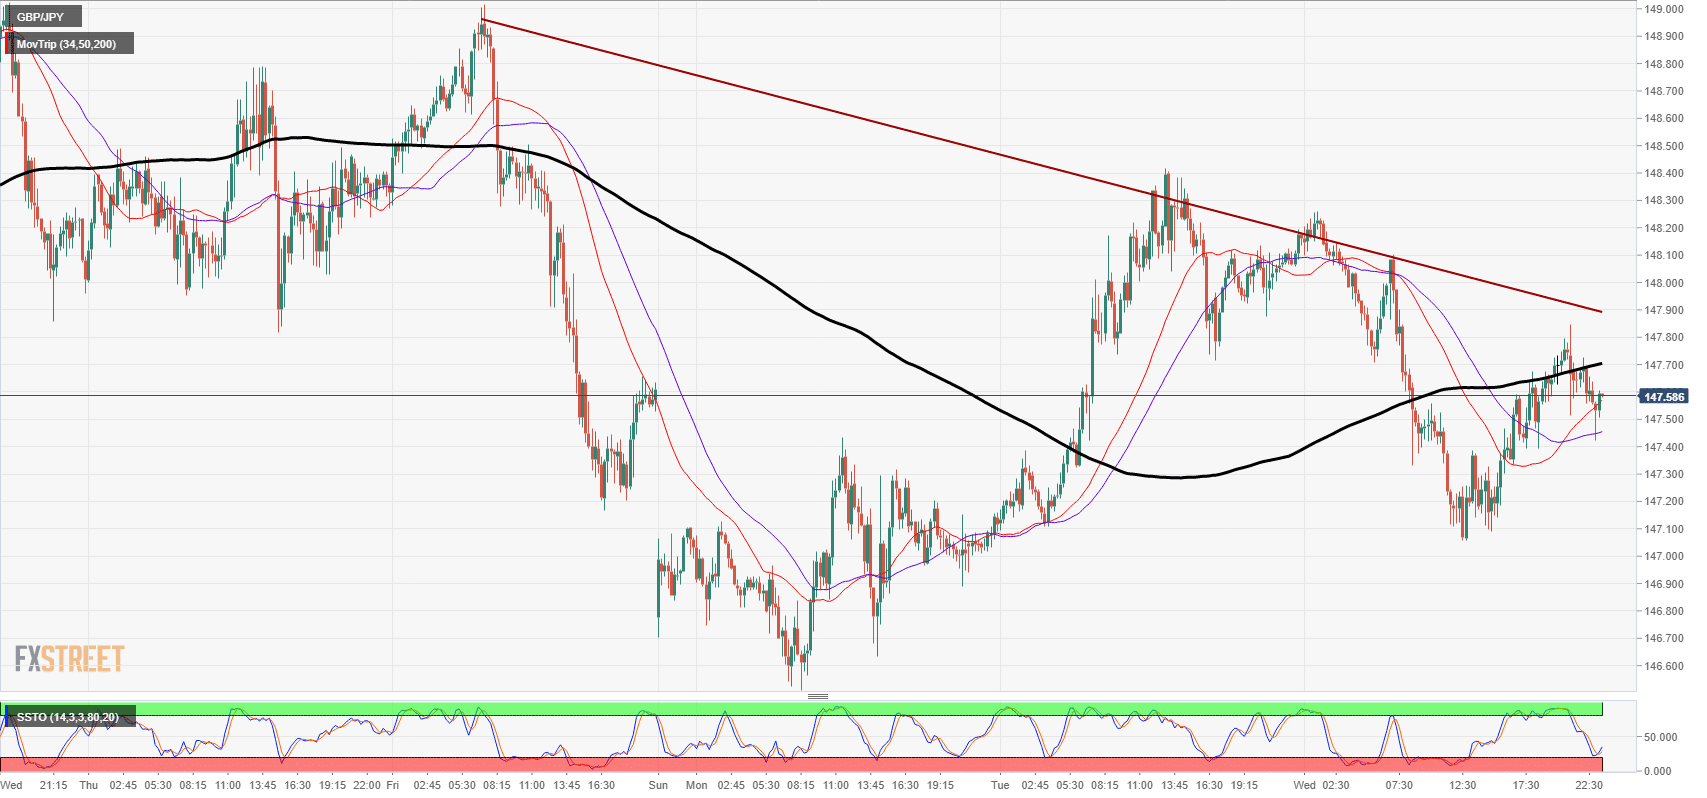
- Hourly charts have the GBP/JPY trapped beneath a declining 200-hour moving average, with consecutive lower highs applying declining trendline resistance.
- The last low remains a potential launching point after last week’s late recovery, and sellers should be wary of a long-side snap on a touch of the 147.00 barrier.
GBP/JPY Chart, 15-Minute
GBP/JPY
Overview:
Last Price: 147.6
Daily change: -38 pips
Daily change: -0.257%
Daily Open: 147.98
Trends:
Daily SMA20: 148.18
Daily SMA50: 145.35
Daily SMA100: 145.84
Daily SMA200: 148.04
Levels:
Daily High: 148.42
Daily Low: 146.89
Weekly High: 149.52
Weekly Low: 147.17
Monthly High: 149.72
Monthly Low: 146.32
Daily Fibonacci 38.2%: 147.83
Daily Fibonacci 61.8%: 147.47
Daily Pivot Point S1: 147.11
Daily Pivot Point S2: 146.24
Daily Pivot Point S3: 145.58
Daily Pivot Point R1: 148.63
Daily Pivot Point R2: 149.29
Daily Pivot Point R3: 150.16
