- The previous twenty-four hours of trading activity saw the GBP/USD take a spike into the 1.3100 technical handle last Friday, but ongoing Brexit concerns has investors cautious, and the Cable is continuing to trade close to 1.3070 as buyers await signs of concrete improvement.
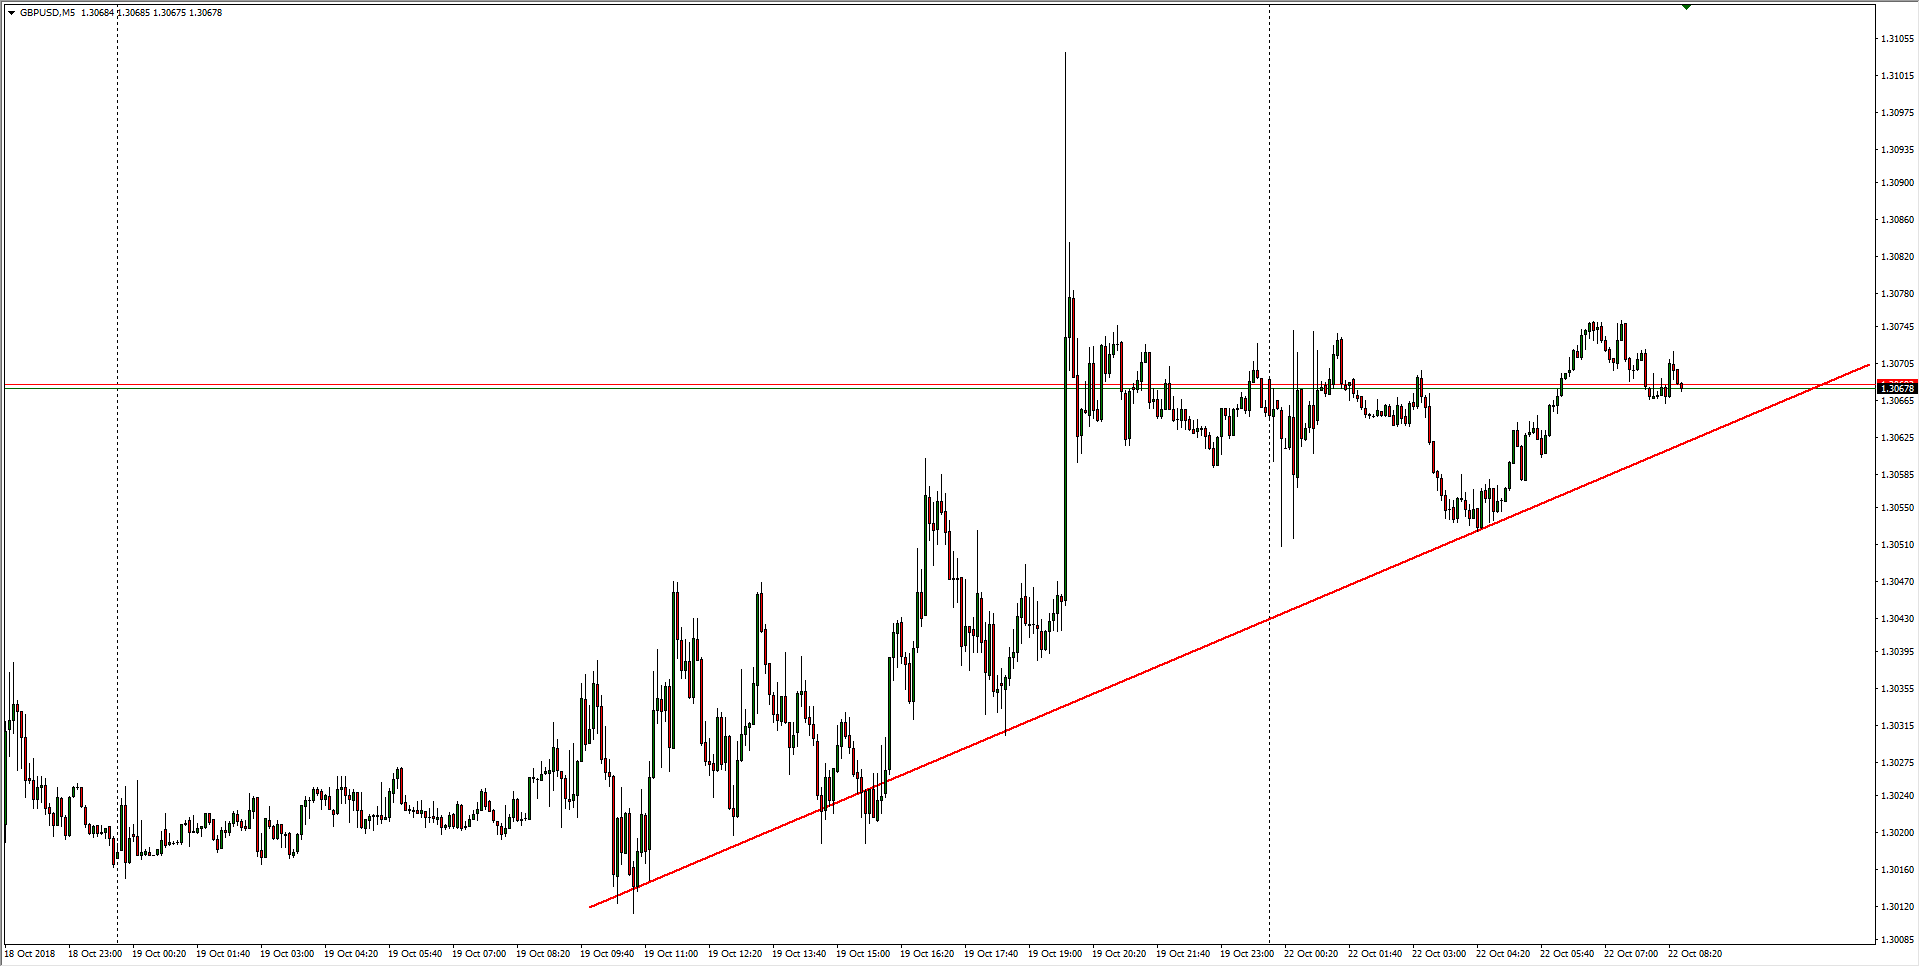
- Bulls aren’t ready to call it quits quite yet on the new trading week, and the GBP/USD’s rising intraday trendline is holding from the day’s swing low into 1.3050.
- GBP/USD analysis: Irish border in the eye of the storm
GBP/USD, M5
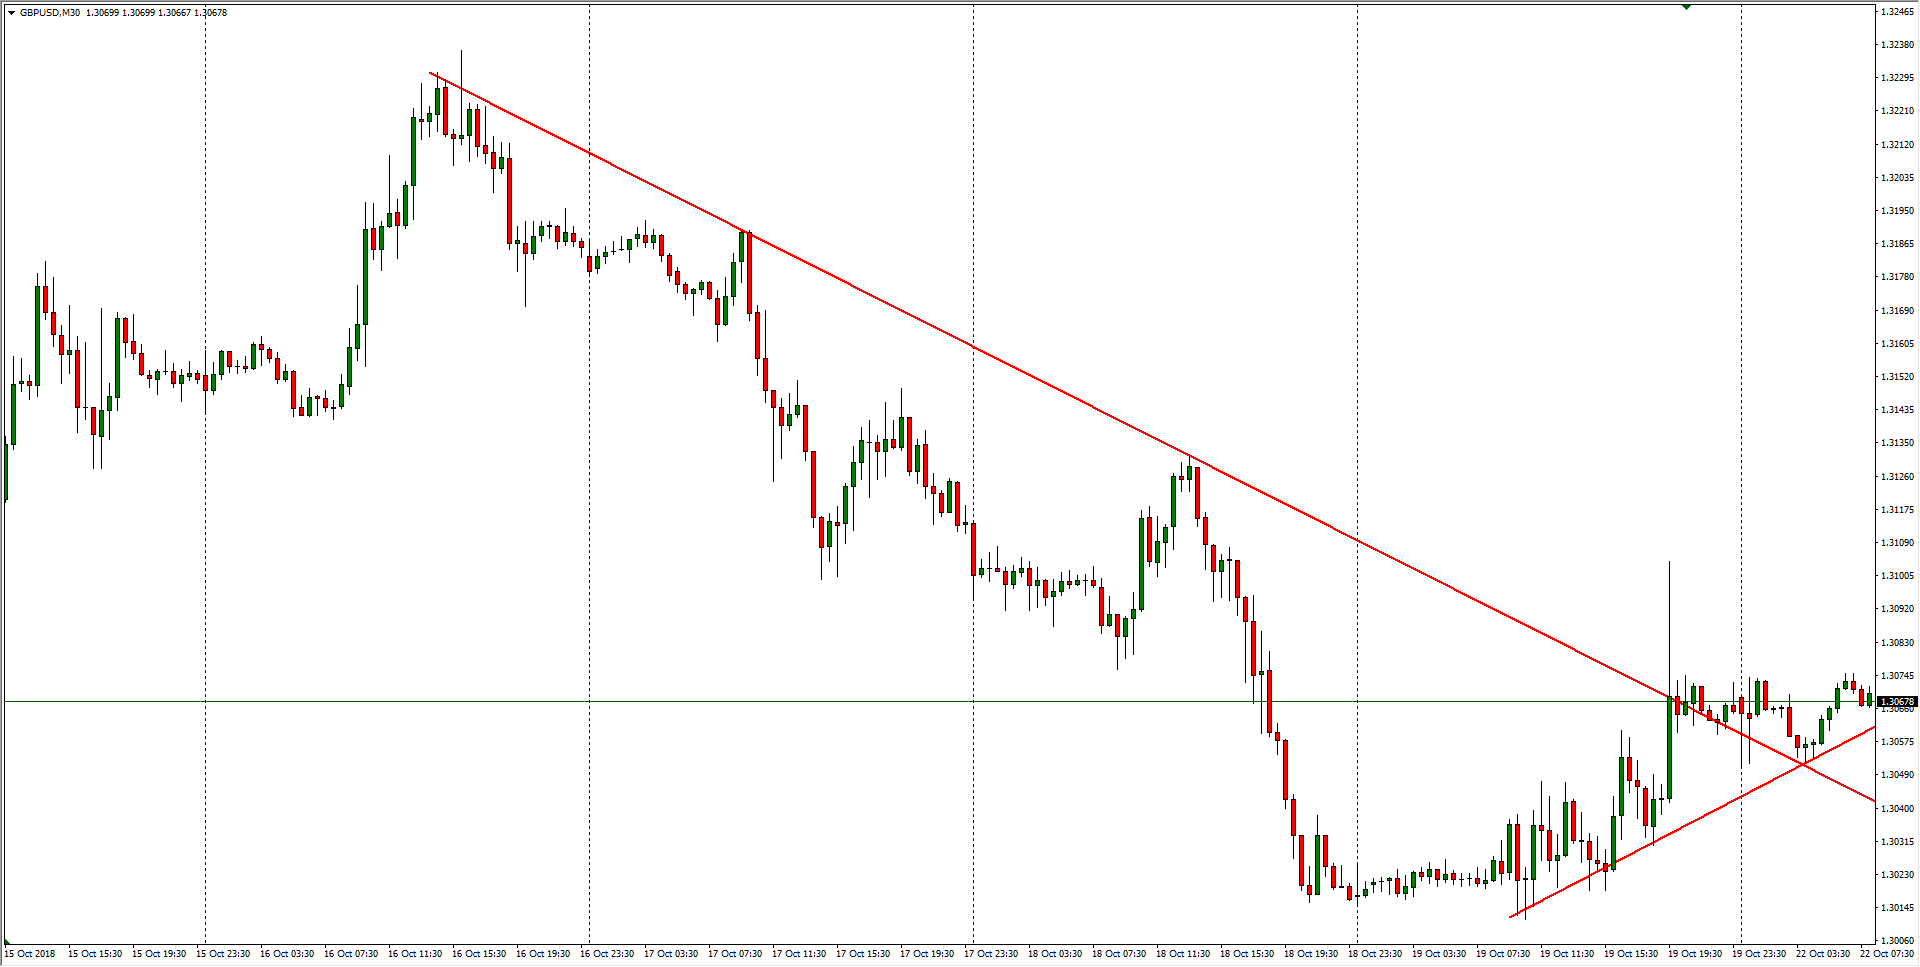
- Over the past week, the Cable has seen a break of the pair’s near-term declining trendline from last week’s peak of 1.3215, and bidders are managing to price in a higher low on the charts.
GBP/USD, M30
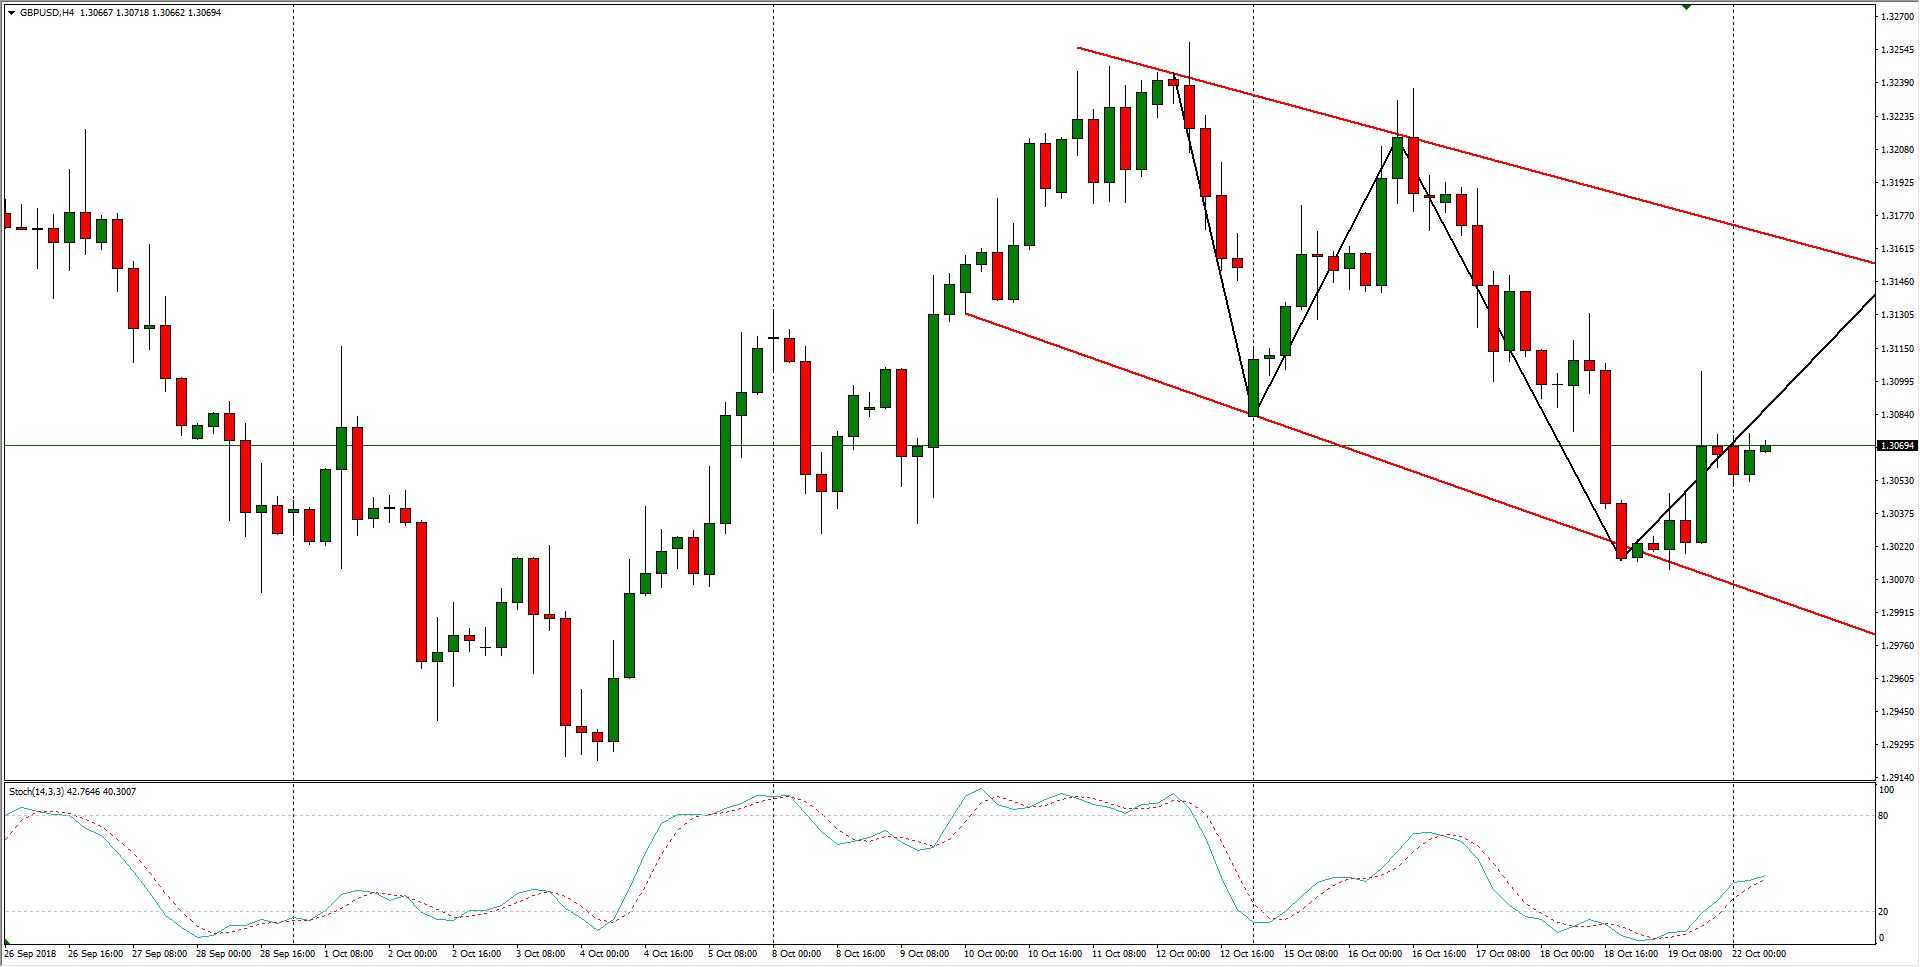
The past month on the Cable charts has begun to form up a potential descending channel, and a potent five-step wave pattern could materialize if the GBP/USD manages to make another push into 1.3150 before beginning a fresh round of sell-offs.
GBP/USD, H4
Don’t forget to check out FXStreet’s Livechart to find out what the Sterling is up to
GBP/USD
Overview:
Last Price: 1.307
Daily change: 2.0 pips
Daily change: 0.0153%
Daily Open: 1.3068
Trends:
Daily SMA20: 1.3101
Daily SMA50: 1.3005
Daily SMA100: 1.3091
Daily SMA200: 1.348
Levels:
Daily High: 1.3106
Daily Low: 1.3011
Weekly High: 1.3238
Weekly Low: 1.3011
Monthly High: 1.33
Monthly Low: 1.2786
Daily Fibonacci 38.2%: 1.307
Daily Fibonacci 61.8%: 1.3047
Daily Pivot Point S1: 1.3018
Daily Pivot Point S2: 1.2967
Daily Pivot Point S3: 1.2923
Daily Pivot Point R1: 1.3112
Daily Pivot Point R2: 1.3156
Daily Pivot Point R3: 1.3206
