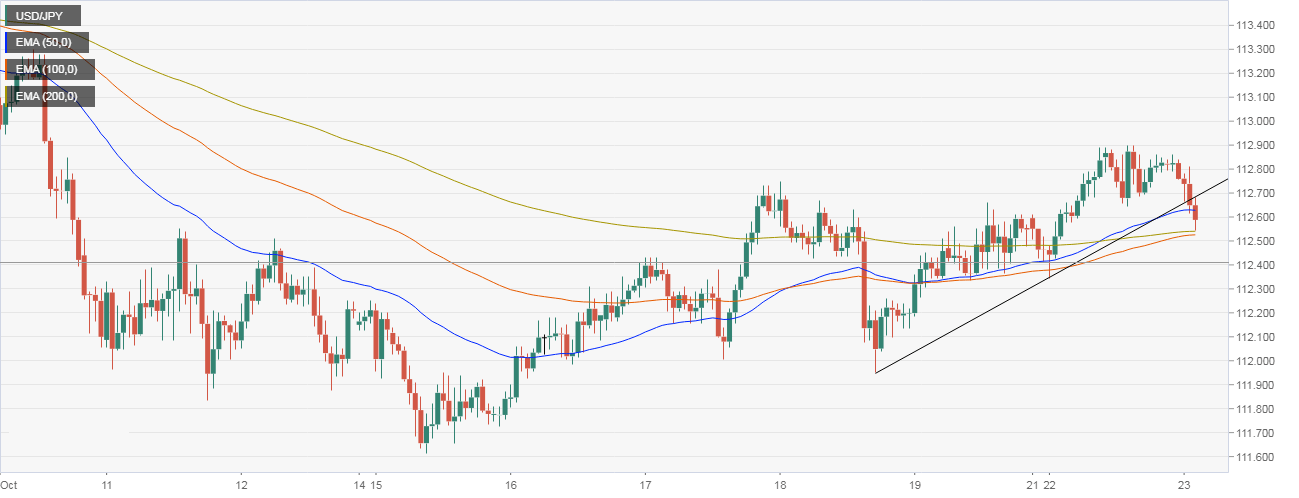
- The USD/JPY cut through rising trendline support earlier today, the hourly chart shows and is now trading below the 50-hour exponential moving average (EMA) of 112.63.
- The anti-risk JPY seems to have picked up a bid, courtesy of a 0.55 percent drop in the S&P 500 futures.
- The key EMAs are biased toward the bulls – 50-hour, 100-hour and 100-hour EMAs are trending north. More importantly, the stacking order of the 50-hour EMA, above the 100-hour EMA, above the 200-hour EMA is a classic bull signal.
- Further, the pair closed well above 112.73 yesterday, signaling a revival of the recovery rally from the recent low of 111.62. Hence, the spot could bounce off the 200-hour EMA of 112.54.
- However, the support at 112.54 would be breached if the risk aversion worsens. Also, a daily close below 112.73 would weaken the odds of a rally to 113.18.
Hourly Chart
Spot Rate: 112.57
Daily High: 112.84
Daily Low: 112.55
Trend: bullish
R1: 112.89 (previous day’s high)
R2: 113.09 (50% Fib R of 114.55/111.62)
R3: 113.18 (July high)
Support
S1: 112.54 (5-day EMA)
S2: 112.34 (10-day EMA)
S3: 112.03 (50-day EMA)
