The past twenty-four hours has seen the NZD/USD struggle against the US Dollar, pushing sideways through Thursday’s action and remaining constrained near 0.6520 heading into Friday’s trading window.
NZD/USD, M5
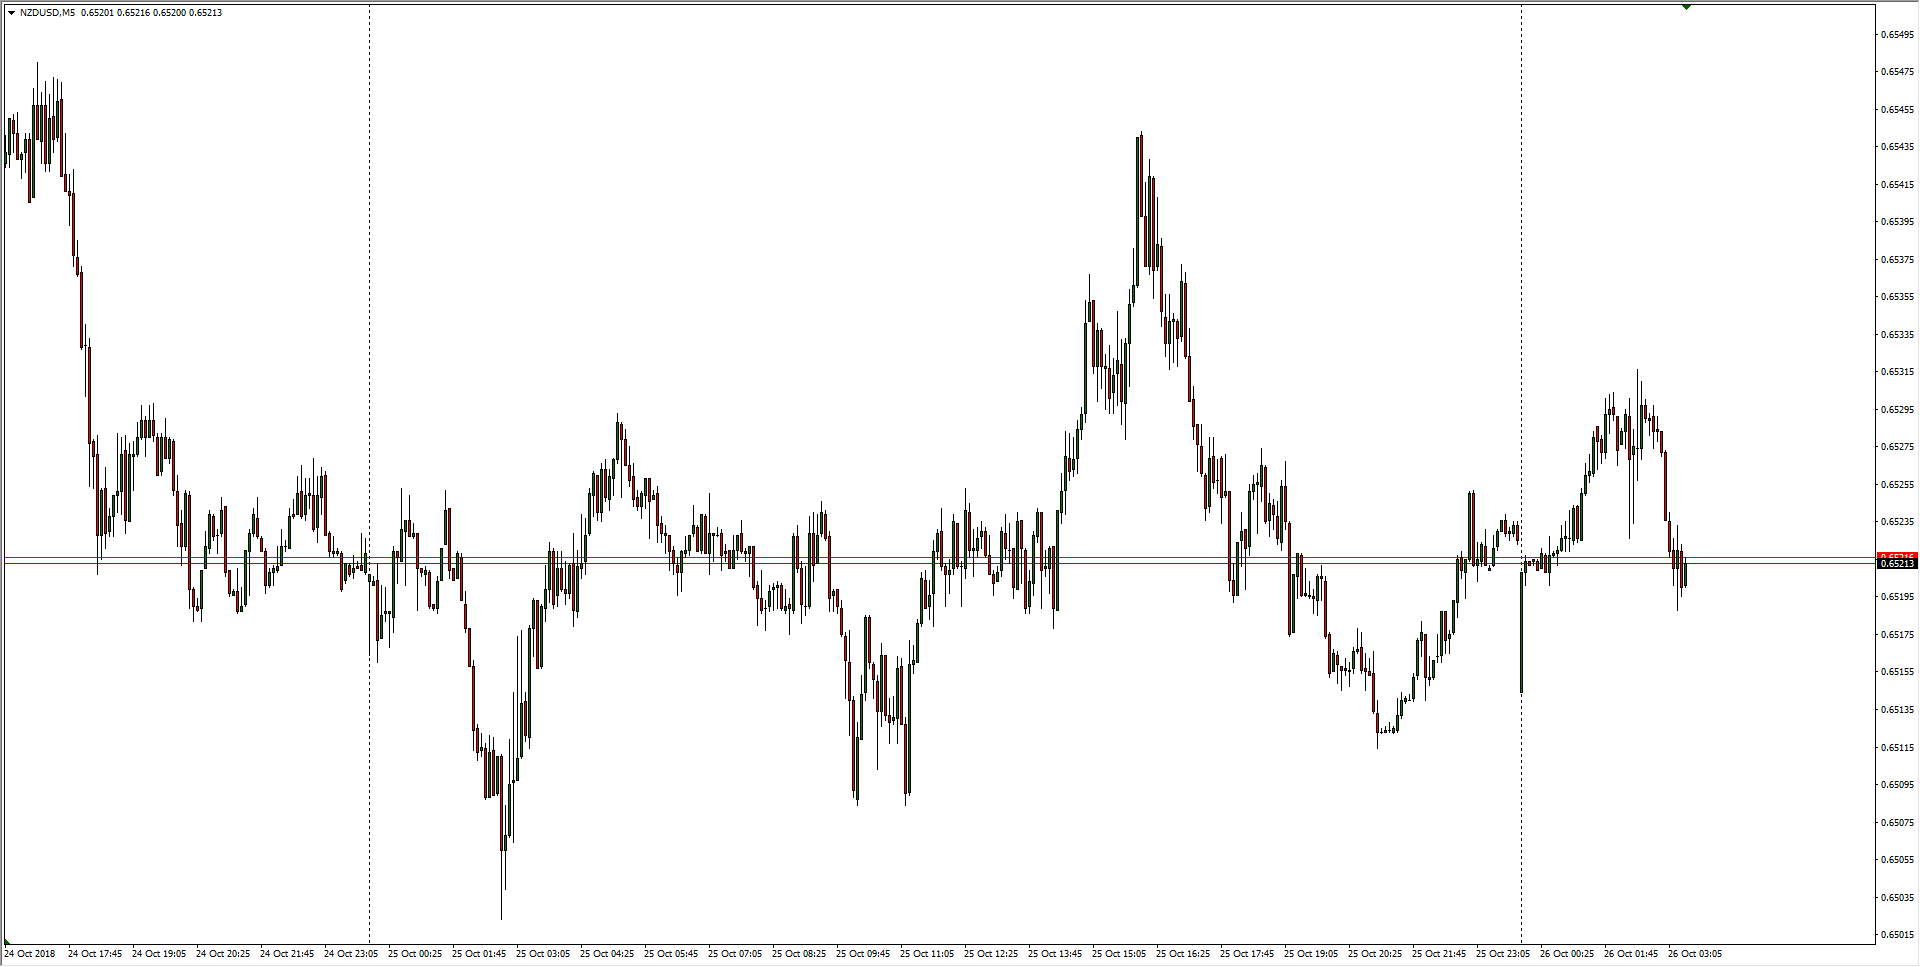
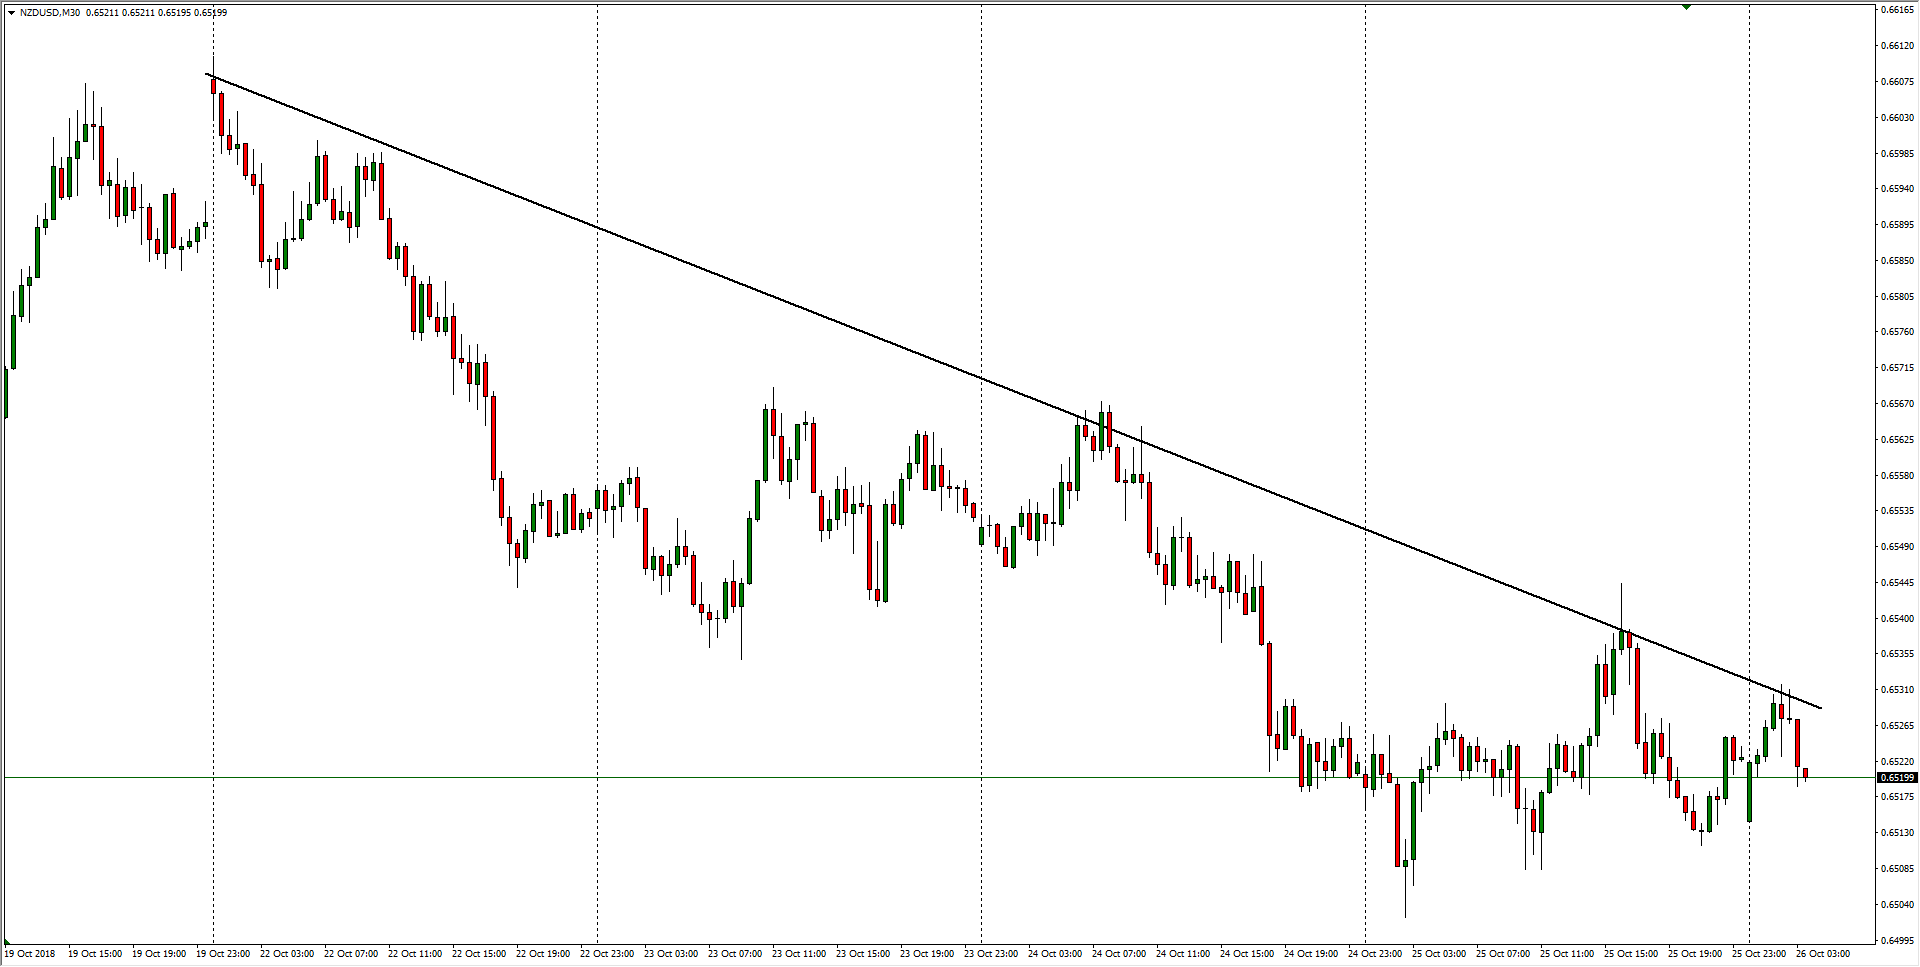
Over the past week the Kiwi has seen itself falling victim to a declining trendline from Monday’s peak near the 0.6600 handle, and a rising US Dollar has spent most of this week defeating all comers, especially the middling NZD.
NZD/USD, M30
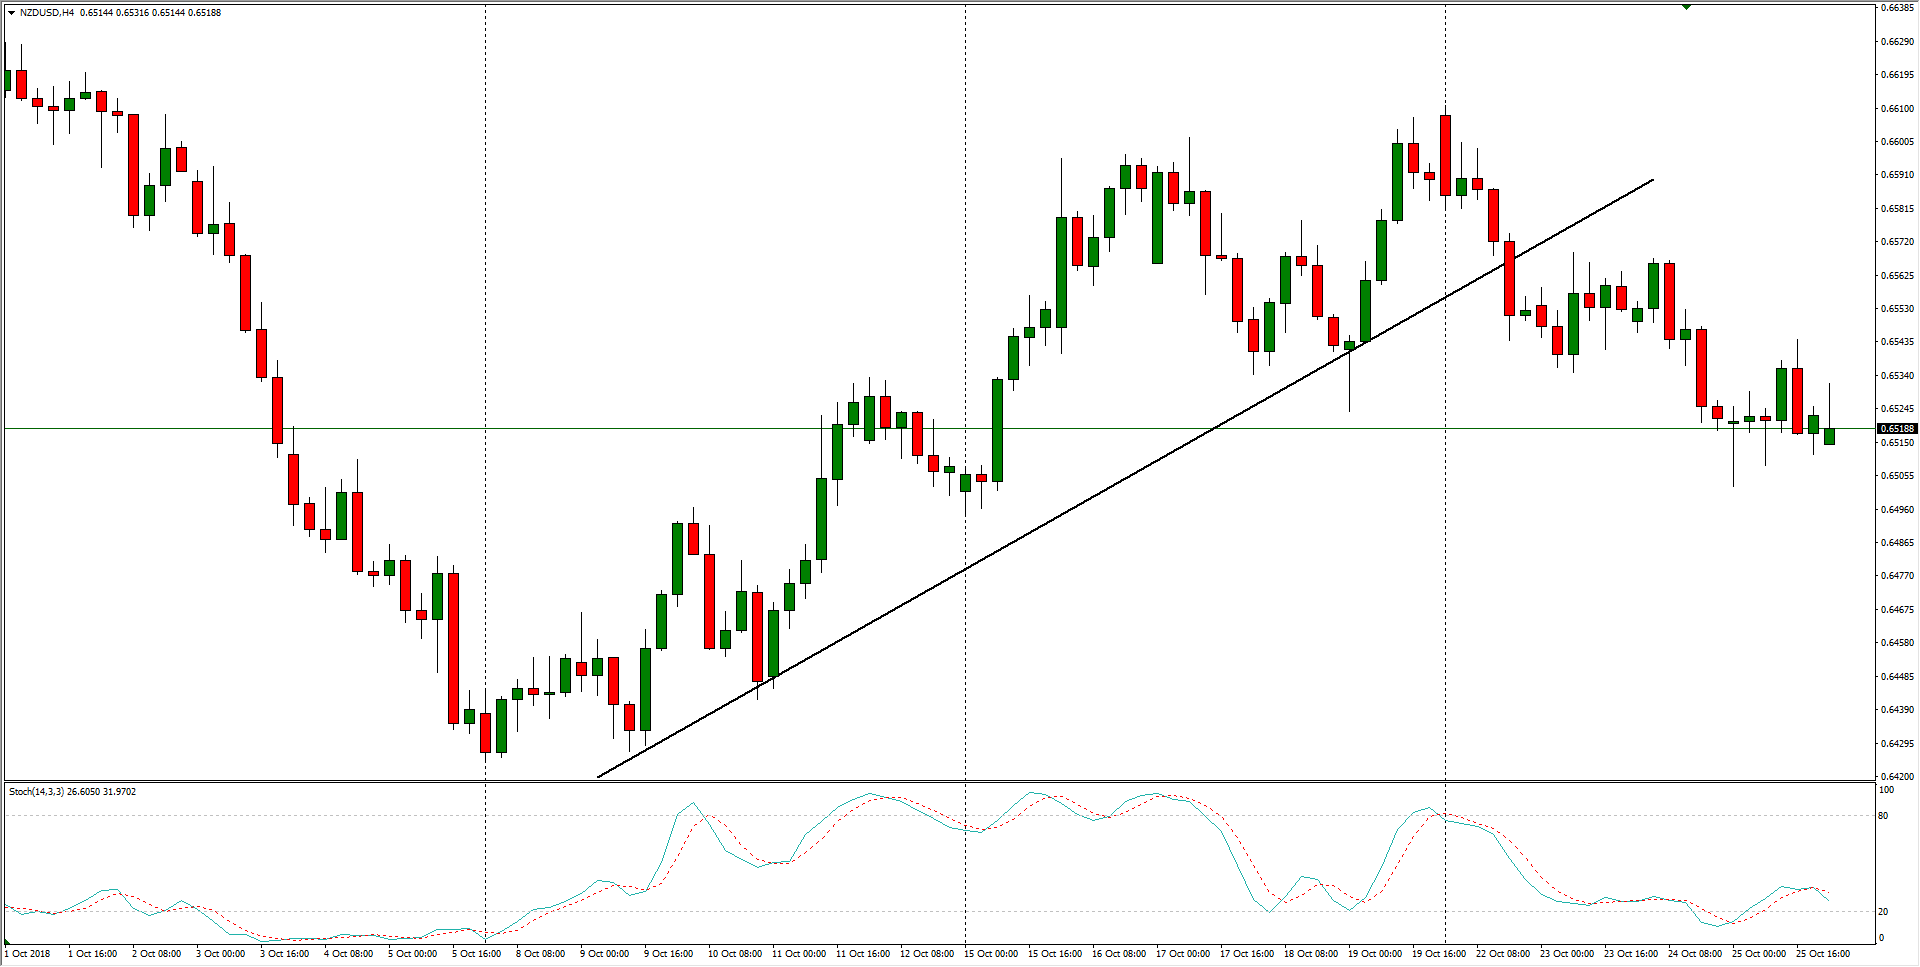
The past month saw the NZDUSD attempt a bullish recovery from the 0.6400 region, but this week’s recovery of the Greenback snapped the rising trendline and set the Kiwi back onto a bearish path once more.
NZD/USD, H4
NZD/USD
Overview:
Last Price: 0.6521
Daily change: 0.0 pips
Daily change: 1.42e-14%
Daily Open: 0.6521
Trends:
Daily SMA20: 0.6531
Daily SMA50: 0.6587
Daily SMA100: 0.6693
Daily SMA200: 0.6943
Levels:
Daily High: 0.6546
Daily Low: 0.6502
Weekly High: 0.6609
Weekly Low: 0.6494
Monthly High: 0.67
Monthly Low: 0.6501
Daily Fibonacci 38.2%: 0.6519
Daily Fibonacci 61.8%: 0.6529
Daily Pivot Point S1: 0.6501
Daily Pivot Point S2: 0.648
Daily Pivot Point S3: 0.6458
Daily Pivot Point R1: 0.6544
Daily Pivot Point R2: 0.6566
Daily Pivot Point R3: 0.6587
